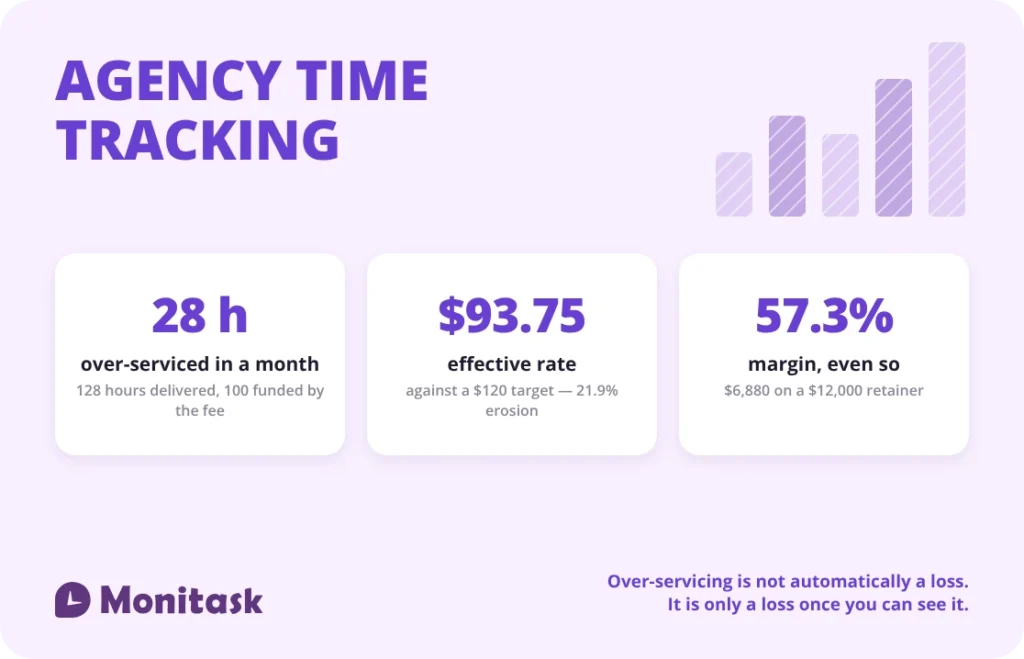

Agency time tracking exists to answer one question: did the fee cover the work. A $12,000 monthly retainer at a $120 target rate funds 100 hours. Deliver 128 and the effective rate drops to $93.75, with 28 hours of over-servicing worth $3,360. Hours by client, by role and by activity are what turn a retainer into a margin number.
Key takeaways
- Over-servicing = hours delivered − hours the fee funds. It is the one metric only agencies have, and it is invisible without hours by client.
- A blended rate hides the role mix. The same 128 hours priced by role come to $15,280 against a $12,000 fee — a 21.5% discount that the blended figure of $119.38 conceals.
- Profit per client uses the burdened cost rate, not the billing rate. A $28.00 wage costs about $40.00 an hour.
- Over-servicing is not automatically a loss. This client runs 28% over and still returns 57.3% margin. On its own numbers the fee is not gone until 300 hours.
- Pitch time is the missing code in most agencies. Four pitches at 60 hours each, won one in four, puts the cost of a new client at $9,600.
What makes agency time tracking different?
Agencies sell blocks of capacity against fixed fees, which creates a problem a timesheet has to solve: the fee is agreed before the work is known. Five requirements follow.
| Requirement | Why a generic timer is not enough |
|---|---|
| Client and project on every entry | Over-servicing is measured per client; a general total cannot show it |
| Role or rate band on the entry | A blended rate hides which roles over-deliver |
| Activity code — strategy, creative, production, PM | Fee inputs differ by activity, and so do rates |
| Revision round captured | Rounds beyond the agreed number are scope, not goodwill |
| New business coded separately | Pitch time is the cost of sale and nobody can see it otherwise |
The first requirement is the one agencies most often miss in practice. Time logged to “Client X” without a project cannot be matched to a specific retainer or statement of work, so it ends up in a monthly total that nobody can act on.
What is over-servicing and how do you measure it?
Over-servicing is work delivered beyond what the fee funds. It is distinct from non-billable time: non-billable time belongs to no client, while over-servicing is time on a client’s work that the client is not paying for.
Hours the fee funds = fee ÷ target rate
Over-servicing = hours delivered − hours the fee funds
Over-servicing rate = over-serviced hours ÷ hours the fee funds
Effective rate = fee ÷ hours delivered
A client on a $12,000 monthly retainer with a $120 target blended rate, where the team logged 128 hours:
| Hours the fee funds: $12,000 ÷ $120 | 100.0 |
| Hours delivered | 128.0 |
| Over-servicing | 28.0 hours |
| Value at the target rate | $3,360.00 |
| Over-servicing rate | 28.0% |
| Effective rate: $12,000 ÷ 128 | $93.75 |
| Shortfall against target | $-26.25 per hour |
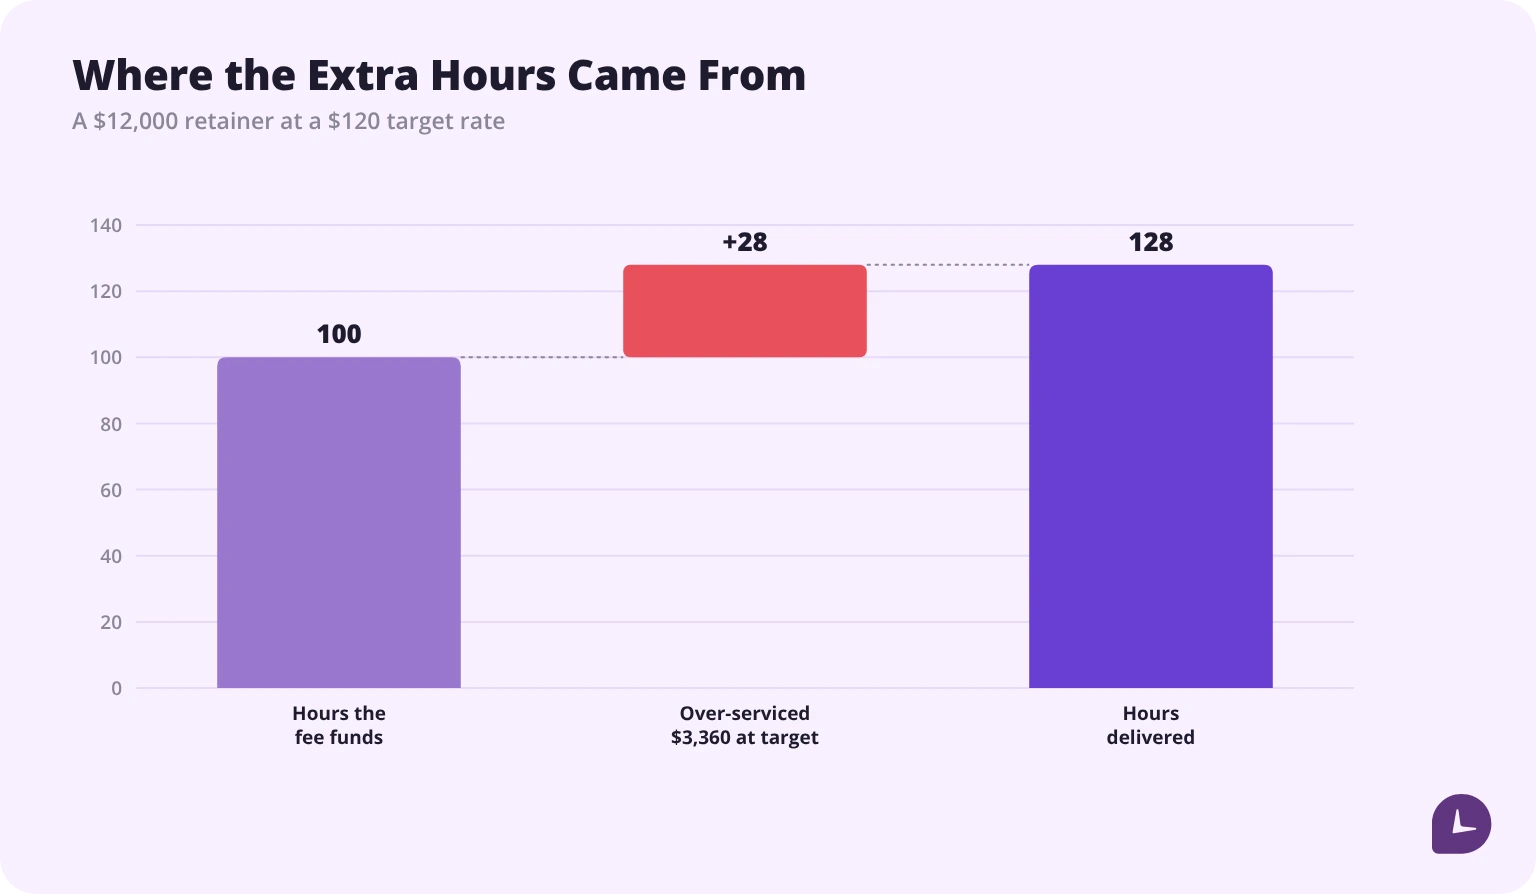
Three things follow from that table.
The retainer is still being delivered — the client has no complaint. The agency is earning $93.75 an hour against a $120 plan, which is 21.9% rate erosion nobody agreed to. And the number is only visible because hours were logged against this client specifically.
There is a fourth, and it is the one to take into the renewal: to hold the target rate at 128 hours the fee would have to be $15,360 — $3,360 more, or 28%. That is the same figure as the over-serviced value, which is not a coincidence: both are the gap between what was delivered and what was funded, priced at target. An over-servicing number is a repricing proposal with the arithmetic already done.
How do you track time against a retainer?
A retainer is a monthly block, and three decisions have to be made before the first entry.
| Decision | Options | What it changes |
|---|---|---|
| Does the unused balance roll over? | Expires monthly · rolls one month · rolls to quarter end | Expiry makes under-delivery revenue; rolling creates a liability to track |
| What happens past the block? | Stops · billed at an overage rate · absorbed as over-service | Only the second produces revenue; the third needs a cap |
| Does the client see the burn? | Monthly statement · live portal · on request | A visible burn prevents the end-of-month argument and requires accurate daily entry |
Retainer burn = hours logged ÷ hours the fee funds
Set alerts at 75% and 90% of the block — on this client, 75 and 90 hours. A percentage on its own tells you nothing; what matters is when it fires. This team delivered 128 hours across a 22-working-day month, 5.82 a day, so the 75% alert reaches them on day 12.9, the 90% alert on day 15.5, and the funded block is gone on day 17.2 — with 4.8 working days of the month still to serve. The first alert buys 4.3 working days to decide, which is the entire argument for setting one. The common failure is finding out afterwards, at which point the only choices are an awkward conversation or absorbing it.
Where a scope of work sits alongside the retainer — a campaign, a site build — keep it as a separate project with its own budget. Mixing project hours into the retainer burn makes both unreadable.
Blended rate or role rates?
A blended rate charges one figure for every hour regardless of who worked it. Role rates charge by seniority and discipline. Most agencies quote blended and deliver with a role mix, which is where the margin goes missing.
The same 128 hours from the example, priced at rate card:
| Role | Hours | Rate | Value |
|---|---|---|---|
| Strategy | 12 | $180 | $2,160 |
| Creative | 40 | $140 | $5,600 |
| Production | 56 | $95 | $5,320 |
| Project management | 20 | $110 | $2,200 |
| Total | 128 | $15,280 |
| Actual blended rate: $15,280 ÷ 128 | $119.38 |
| Sold for | $12,000.00 |
| Discount to rate card | $3,280.00, or 21.5% |
The blended figure of $119.38 looks like a near miss against a $120 target — $0.62 short. The role view shows what actually happened: the work was worth $15,280 at rate card and went out at $12,000. Two numbers that differ by $0.62 and by $3,280 are describing the same month.
| Blended rate | Role rates | |
|---|---|---|
| Simplicity for the client | High — one number | Lower — a rate card to explain |
| Shows which role over-delivers | No | Yes |
| Survives a role-mix change | No — a shift toward junior work quietly erodes value | Yes |
| Suits | Short projects, one discipline | Retainers, multi-discipline work |
| Risk | Senior time priced as junior, or the reverse | Clients negotiating individual rates down |
A workable compromise: quote blended, track by role. The client sees one rate, and the agency can still see that 56 of 128 hours — 43.8% of the month — were production at $95, and that this is what pulled the blended figure down.
How do you calculate profit per client?
Profit uses the cost of an hour, not the price of one. The two are frequently confused, and the confusion makes every client look profitable.
Burdened cost rate = base hourly wage × burden multiplier
US private-sector employer costs averaged $46.89 per hour worked in June 2026 — $32.82 in wages and salaries and $14.07 in benefits, according to the Bureau of Labor Statistics release of 9 September 2026. Benefits are 30.0% of total compensation, which is 42.9% on top of the wage, so the multiplier is about 1.43.
A $28.00 base wage therefore costs about $40.00 an hour.
Profit per client = fee − (hours delivered × burdened cost rate)
| Hours delivered | 128.0 |
| Burdened cost of delivery: 128 × $40.00 | $5,120.00 |
| Fee | $12,000.00 |
| Profit | $6,880.00 |
| Margin | 57.3% |
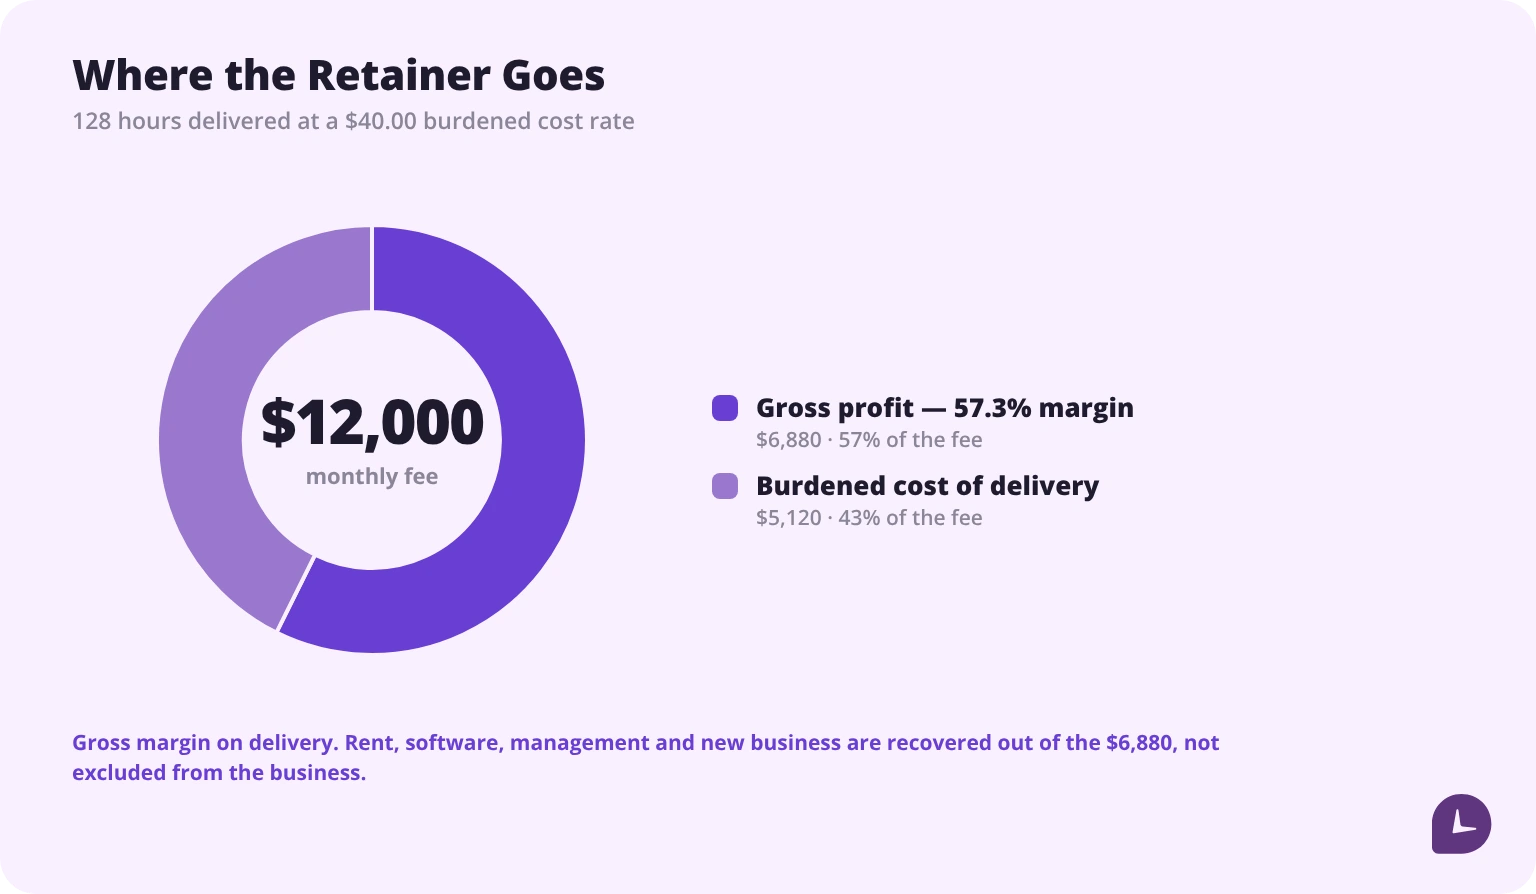
This is the number that makes over-servicing a decision rather than a panic. The client ran 28% over the hours the fee funded and still returned 57.3% margin before agency overhead.
Use your own wages, not the national average
One trap is worth naming, because it changes the answer by a factor rather than by a rounding. Agency staff do not sit in the all-private average. BLS publishes a separate figure for management, professional and related occupations in private industry, and in June 2026 it was $78.88 per hour worked — $54.06 in wages and $24.82 in benefits. That is 1.68 times the $46.89 all-private figure.
The useful part is what does not change. The multiplier for that group is 1.46 against 1.43 for all private workers — a difference of 0.03. Run the same month on it and the $28.00 wage costs $40.86 instead of $40.00, profit becomes $6,769.92 and margin 56.4%, 0.9 of a point lower.
So the multiplier method is sound and the choice of multiplier barely matters. What matters is the wage you multiply. An agency that reaches for $46.89 as “the cost of an hour” because it is the headline BLS number is using an average that includes every private-sector job in the country. Use your own payroll and BLS for the multiplier only.
Two further cautions on this calculation.
It is gross margin on delivery: rent, software, management and new business sit above it and are recovered from the $6,880, not excluded from the business. And ECEC measures cost per hour worked, not per hour paid — paid leave is already spread across the hours actually worked. Deducting leave from capacity and using a burdened rate counts it twice.
So when does over-servicing actually cost money?
Rules of thumb circulate — ten to fifteen per cent is fine, past twenty-five it is a pricing problem. Before using either, it is worth knowing that no agency benchmarking organisation publishes an over-servicing percentage at all. Those numbers are practitioner lore rather than findings, and we could not trace either of them to a survey.
What is published is incidence, not a rate. Ignition’s 2025 Agency Pricing and Cash Flow Report, a survey of 273 US agency leaders, found 57% losing between $1,000 and $5,000 a month to unbilled scope creep and a further 30% losing more than $5,000 — and just 1% billing for all of their out-of-scope work. The practice is close to universal; what nobody publishes is how much of a fee it represents.
Which leaves the question to be answered per client, from the agency’s own numbers. The rules of thumb are about the client relationship, and on that they are reasonable. They are not about the money, and the money is computable from two figures already on this page.
At a $40.00 burdened rate, a $12,000 fee buys 300 hours of delivery before the fee is gone entirely. The funded block is 100. So on this client’s own numbers, over-servicing does not cost the agency a cent until it reaches 200 hours, or 200%.
| Hours delivered | Over-servicing | Effective rate | Gross profit | Margin |
|---|---|---|---|---|
| 100 | 0 h · 0% | $120.00 | $8,000 | 66.7% |
| 115 | 15 h · 15% | $104.35 | $7,400 | 61.7% |
| 128 | 28 h · 28% | $93.75 | $6,880 | 57.3% |
| 150 | 50 h · 50% | $80.00 | $6,000 | 50.0% |
| 200 | 100 h · 100% | $60.00 | $4,000 | 33.3% |
| 300 | 200 h · 200% | $40.00 | $0 | 0.0% |
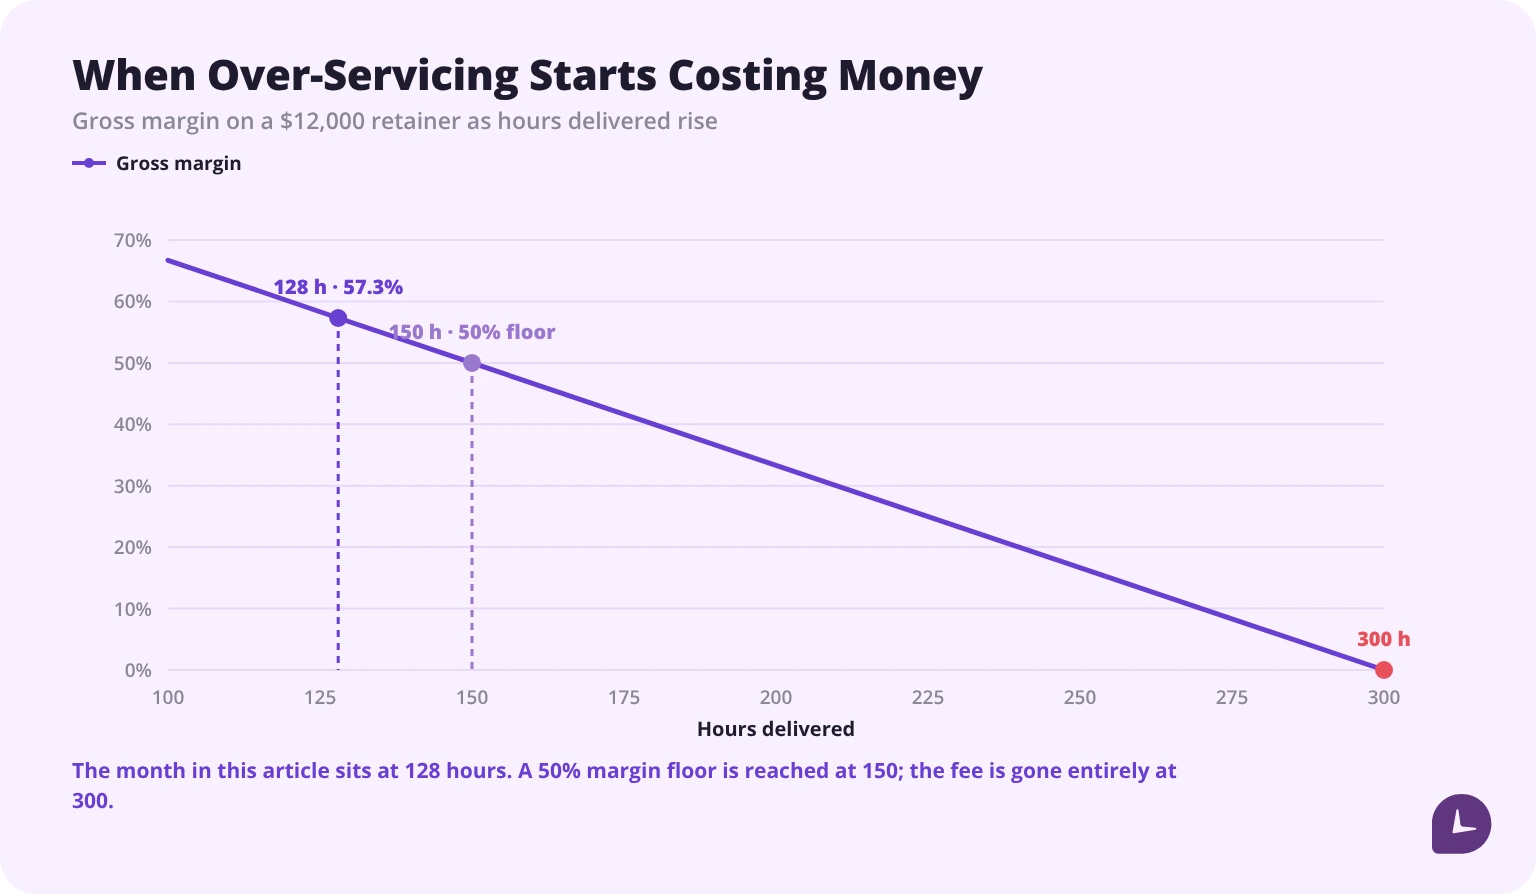
The real constraint is not a rule of thumb, it is whatever margin the agency needs. Hold a 50% floor and the ceiling on this client is 150 hours — 50% over-servicing, twice what the rule of thumb allows. A different client at a lower fee or a more senior mix will have a ceiling far below it.
Which is the argument for tracking rather than for a policy. 28% over-servicing is comfortable here and ruinous somewhere else, and the only way to know which is to have the hours. Where the rule of thumb earns its keep is the conversation: past about a quarter over, the fee has stopped describing what the client expects to receive, and that is worth fixing whatever the margin says. Scope creep is the same problem seen from the delivery side.
How do revision rounds control scope?
Creative work expands through revisions, and revisions are the cheapest scope control an agency has because they are countable.
The mechanism: the fee covers a stated number of rounds. Rounds beyond that are a change, priced or absorbed deliberately rather than by default.
| Round | Status | What happens |
|---|---|---|
| Round 1 | Included | Internal review, then client feedback |
| Round 2 | Included | Consolidated client feedback applied |
| Round 3 | Change | Quoted as additional, or absorbed with the decision recorded |
| New direction at any round | Change | Resets the work; priced as new, not as a revision |
Three rules make it hold.
Count rounds as a field on the time entry, not in the project manager’s memory. A round is a billing fact and needs to be in the data.
Define what a round is in the statement of work. One consolidated set of feedback is a round. Five people sending separate comments over three days is also one round, if the document says so — and three rounds if it does not.
Distinguish a revision from a new direction. Revising a concept is a round. Replacing the concept is new work at full price, and an agency that treats it as round four has given away the project.
There is no trade-body standard for how many rounds a fee should include, and the best evidence for that is the design profession’s own contract. AIGA’s Standard Form of Agreement for Design Services leaves the number blank: it tells you to describe “the number of revisions or refinements that are included” in the proposal for each engagement, and its clause on substantive changes sets the threshold as work “in or near excess of ____ percent (____%)” of the time required — a blank for you to fill. The nearest thing the industry has to a standard over-servicing threshold is an empty space in a form.
So the number is yours to set, and the statement of work has to set it explicitly, because the default in the absence of a number is however many the client asks for.
What does it cost to win a client?
Most agencies cannot answer this, because new business time is not coded.
Cost per pitch = pitch hours × burdened cost rate
Cost per win = cost per pitch ÷ win rate
| Hours per pitch | 60 |
| Cost per pitch at $40.00 | $2,400.00 |
| Win rate | 25%, or 4 pitches per win |
| Cost per win | $9,600.00 |
Set against the $6,880 monthly profit from the worked example, a new client repays its acquisition cost in about 1.4 months. That is a healthy number, and the point is that it cannot be computed at all without pitch hours.
The same calculation drives two decisions.
It tells you which pitches are worth entering. A client on a $15,000 annual fee returns $8,595.00 at this margin — $1,005.00 less than the $9,600 it cost to win. The client does not repay its own acquisition inside the first year, and that is before anyone counts the account management. Chasing it is a decision an agency should make knowingly, not by default.
And it prices the win rate. Moving from one in four to one in three cuts the cost per win to $7,200 — $2,400 saved per client won, which is usually cheaper to achieve than raising fees. Qualifying harder and pitching less does the same arithmetic from the other end.
How that compares with the published numbers
Sixty hours is a small-agency pitch, and the published research says so. The only study with real hours in it — the OUCH! Factor Report, 94 Australian agency CEOs and MDs reporting on their 2021 pitches — found an average of 231 hours per pitch and 490 hours to win one. That is 3.9 times the hours in the example above, and 2.0 times the 240 hours a win costs at 60 hours and one in four. Run the same method on it and the cost of a client is $19,600 rather than $9,600, repaid in 2.8 months rather than 1.4.
The same study found 33% of the revenue won through pitching was consumed by the cost of pitching, and win rates that differ sharply by discipline: 63.7% for media, 46.5% for creative and 37.3% for digital and technology, against an average of 50%. Those are self-reported and count only pitches the agency was invited into, which flatters them; the 4A’s, whose 2026 new business survey is otherwise members-only, says in the open that most agencies report win rates below 50%.
At the top of the market the numbers stop being comparable at all. The ANA and the 4A’s commissioned research into what a formal agency review costs, and found a challenger agency spending $204,461 on a single pitch and a defending incumbent $406,092, with 11 and 18 staff respectively working on it. And 66% of those reviews ended with the client keeping the agency it already had.
None of which tells you what your own pitches cost. That is the point: the spread between a 60-hour pitch and a 231-hour one is the whole range of the business, and only coded hours put you somewhere in it.
Code new business by stage — qualification, proposal, pitch, follow-up — so a losing pitch can be analysed rather than just absorbed.
Billings or agency gross income?
Agencies report two different revenue numbers, and mixing them makes every per-head metric wrong.
| Billings | Agency gross income (AGI) | |
|---|---|---|
| What it is | Everything invoiced, including pass-through | Fee income the agency keeps |
| Includes media spend, print, third-party production | Yes | No |
| Reflects the agency’s own work | No | Yes |
| Use it for | Client size, cash flow, scale | Rates, margin, revenue per head, utilization |
An agency billing $4,000,000 with $2,600,000 of pass-through media has $1,400,000 of AGI — 35.0% of what it invoiced. Across 20 people, revenue per head is $200,000 on billings and $70,000 on AGI. The first number flatters the agency by 2.86 times, and rates built on it are too low by the same factor.
AGI is in universal use among agency operators, and it is not a defined term. No trade body publishes a definition of it: the 4A’s uses gross income as the variable it sizes agencies by without saying anywhere public what it includes, and the clearest written definitions belong to agency advisers and software vendors rather than to the industry.
That is worth sitting with for a moment, because it is the same problem this article keeps running into. The 4A’s Analysis of Agency Costs Survey Report is the US industry’s only real agency profit-and-loss benchmark — 109 agencies in the 2024 edition — and it is members-only at $675 with a licence forbidding redistribution and nothing at all published in the open. Productive’s survey of 93 agency leaders found fewer than half operating above 10% margins and nearly one in five unable to report their margin at all. An industry that cannot agree what its revenue line means is going to struggle to benchmark what sits under it, which is a reason to get your own numbers right rather than to go looking for someone else’s.
Every metric in this guide uses AGI. Hours are the agency’s own work, so the revenue they are compared against must be too.
How do you handle freelancers in the mix?
A freelancer is a cost line, not a salaried hour, and the difference matters in both directions.
| Employee | Freelancer | |
|---|---|---|
| Cost of an hour | wage × burden multiplier | invoiced rate, no burden |
| Capacity | fixed, paid whether used or not | variable, paid only when used |
| Counts toward utilization | Yes | Usually excluded — it distorts the denominator |
| Effect on client profit | Burdened cost | Direct cost at invoice value |
| Risk | Idle capacity | Availability, and classification |
Three practical points:
- Use the invoiced rate, not a burdened rate, when computing client profit on freelance hours. There is no employer burden on a contractor invoice — that is most of what the contractor’s higher rate is covering.
- Keep freelancers out of the utilization denominator. A freelancer is only ever engaged on billable work, so including them pushes the figure toward 100% and hides the employed team’s real utilization.
- Log freelance hours in the same system. Hours sitting only on an invoice cannot be matched to a project, which breaks over-servicing and client profit for any project with freelance delivery.
One warning about agency utilization benchmarks generally, since they are easy to find and hard to use: the published figures do not share a denominator. Some divide billable hours by available hours, some by total capacity including people who are not billable at all, and some compare against an asserted ideal ratio rather than a measured one. They are not three readings of the same number and should not be put in the same sentence. The one finding that survives the problem, because it is a claim about agencies rather than about a formula, is Teamwork.com’s: in its survey of more than 500 agency leaders, 52% said they struggle to get billable utilization above 50%. Define yours, write the definition down, and compare it only with itself over time.
Which codes does an agency timesheet need?
| Dimension | Values | What it enables |
|---|---|---|
| Client | account list | Over-servicing, profit per client |
| Project or retainer | per engagement | Retainer burn, project budget |
| Role or rate band | strategy, creative, production, PM | Role mix and rate-card comparison |
| Activity | concepting, production, revisions, meetings, QA | Where the fee is actually consumed |
| Revision round | 1, 2, 3+ | Scope control |
| Billable flag | billable, over-service, non-billable | Separating absorbed work from unbilled work |
| New business stage | qualification, proposal, pitch | Cost of acquisition |
| Internal | admin, training, BD support | Overhead, kept out of client numbers |
The sixth row is the one agencies usually get wrong. Over-serviced time is neither billable nor non-billable — it is client work that is not being paid for, and it needs its own value so it can be measured instead of disappearing into one bucket or the other. What counts as non-billable more broadly, and how much of it is normal, is covered in our guide to non-billable hours.
How do you get a creative team to track time?
The objection is real and worth answering honestly: tracking time adds friction to work that depends on uninterrupted attention, and creative teams correctly suspect that hour counts become performance judgements.
Four things make adoption work.
Say what the data is for, and then only use it for that. Pricing the next retainer accurately and defending scope are reasons a creative team accepts. Comparing individuals’ hour counts is not, and doing it once ends the cooperation permanently.
Track at the project and activity level, not the task level. Three entries a day covering concepting, revisions and a client call is enough to run every calculation in this guide. Fifteen entries buys nothing and costs the day.
Make the codes exist before the team logs in. An empty system gets filled with free text that no report can read, and the team concludes the exercise was pointless.
Show the result back. When tracked hours win a scope conversation or justify a fee increase, say so. The $3,360 uplift earlier in this article is the kind of thing worth telling the team about, because it came out of their timesheets. Adoption follows evidence that the data changed something, not reminders.
One thing to avoid: using screenshots or activity monitoring on creative staff while asking them to trust the process. The two are hard to reconcile, and the choice between them is a decision about the kind of agency you are running. More on the operational side of this in our guide to running a remote agency, and on keeping the costs visible in the agency survival guide.
Monitask records hours against client, project and activity codes as the work happens, which is where over-servicing and profit per client come from — and exports them to timesheets for invoicing.
See time tracking for agencies
Sources
- Bureau of Labor Statistics, Employer Costs for Employee Compensation, June 2026 — released 9 September 2026
- Bureau of Labor Statistics, ECEC Table 4: private industry workers by occupational and industry group
- ANA and 4A’s, The Cost of the Pitch, 2023
- New Business Methodology and SI Partners, The OUCH! Factor Report 2022
- Ignition, 2025 Agency Pricing and Cash Flow Report
- 4A’s, New Business Activity and Resources Survey 2026
- 4A’s, Analysis of Agency Costs Survey Report, 2024 edition
- Productive, The State of the Agency Business 2025
- Teamwork.com, The State of Agency Operations, 2023
- AIGA, Standard Form of Agreement for Design Services
FAQ
What is over-servicing in an agency?
Over-servicing is work delivered beyond what the fee funds. A $12,000 retainer at a $120 target rate funds 100 hours; delivering 128 means 28 hours of over-servicing worth $3,360, and an effective rate of $93.75 instead of $120. It differs from non-billable time, which belongs to no client at all.
How much over-servicing is normal?
Ten to fifteen per cent is the usual rule of thumb, and past roughly a quarter the fee has stopped describing what the client expects — but no agency benchmarking organisation publishes an over-servicing percentage, so treat both as lore. What is published is incidence: Ignition’s 2025 survey of 273 US agency leaders found 57% losing $1,000 to $5,000 a month to unbilled scope creep. The financial threshold is a separate question. On the worked example in this article, at a $40.00 burdened cost rate, the fee is not exhausted until 300 hours — 200% over-servicing — and a 50% margin floor is reached at 50%. Compute your own ceiling; it will not be the rule of thumb.
Should an agency use a blended rate or role rates?
Quote blended if the client prefers one number, but track by role. The same 128 hours priced at rate card come to $15,280 against a $12,000 fee — a 21.5% discount that a blended figure of $119.38 completely hides, along with the fact that 56 of those hours were production at $95.
How do you calculate profit per client?
Subtract the burdened cost of delivery from the fee: fee minus hours delivered multiplied by the burdened cost rate. At 128 hours and a $40.00 burdened rate, delivery costs $5,120 against a $12,000 fee, giving $6,880 of gross profit and a 57.3% margin before agency overhead.
What is a burdened cost rate?
The full hourly cost of an employee to the employer: the base wage plus payroll taxes, benefits, paid leave and insurance. US private-sector costs averaged $46.89 per hour worked in June 2026, of which $14.07 was benefits — about 42.9% on top of wages, so a multiplier of roughly 1.43. Apply the multiplier to your own payroll, not to the BLS average wage.
How do revision rounds control scope?
The fee covers a stated number of rounds, and anything beyond is a priced change rather than a favour. It works only if the round is a field on the time entry, if the statement of work defines what counts as one round, and if a change of direction is treated as new work rather than another revision. No trade body sets a standard number, so the statement of work has to.
How do you calculate the cost of winning a client?
Multiply pitch hours by the burdened cost rate to get the cost per pitch, then divide by the win rate. Sixty hours at $40.00 is $2,400 per pitch; a one-in-four win rate puts the cost of a new client at $9,600. The calculation is impossible without new business time coded separately.
What is the difference between billings and agency gross income?
Billings are everything invoiced, including pass-through media and third-party production. Agency gross income is the fee income the agency keeps for its own work. An agency billing $4,000,000 with $2,600,000 of pass-through has $1,400,000 of AGI, so revenue per head on billings overstates by 2.86 times. Rates, margin, revenue per head and utilization must all be computed on AGI.
Should freelancer hours count toward utilization?
Usually not. Freelancers are engaged only on billable work, so including them pushes utilization toward 100% and conceals the employed team’s real figure. Their hours should still be logged in the same system, at their invoiced rate rather than a burdened rate, so project profitability remains complete.