
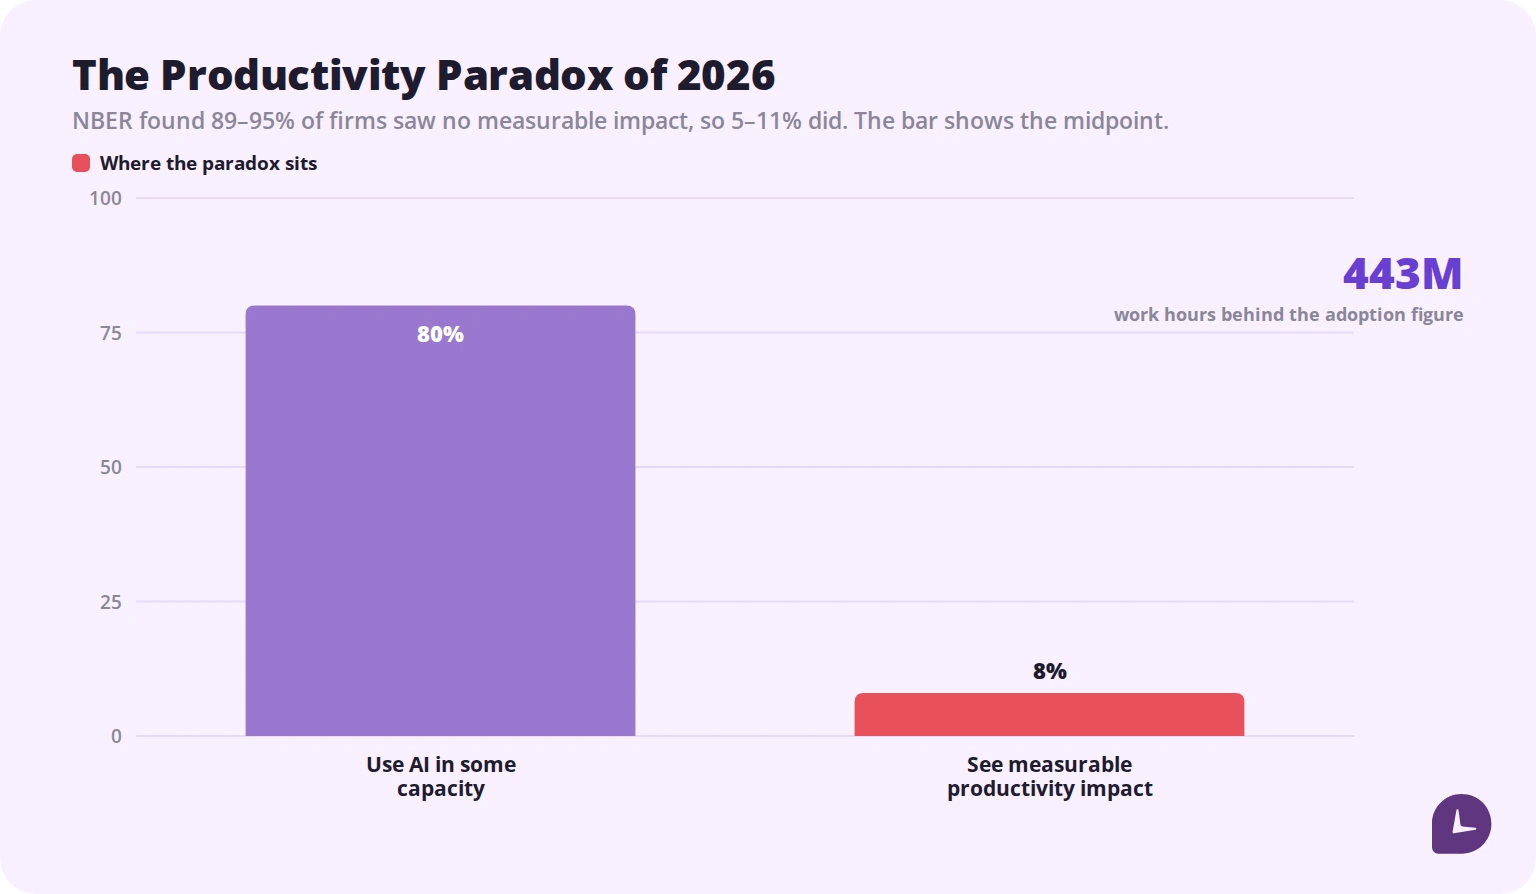
The defining productivity story of 2026 is not that AI arrived. It is that AI arrived almost everywhere and the results have not shown up on the balance sheet.
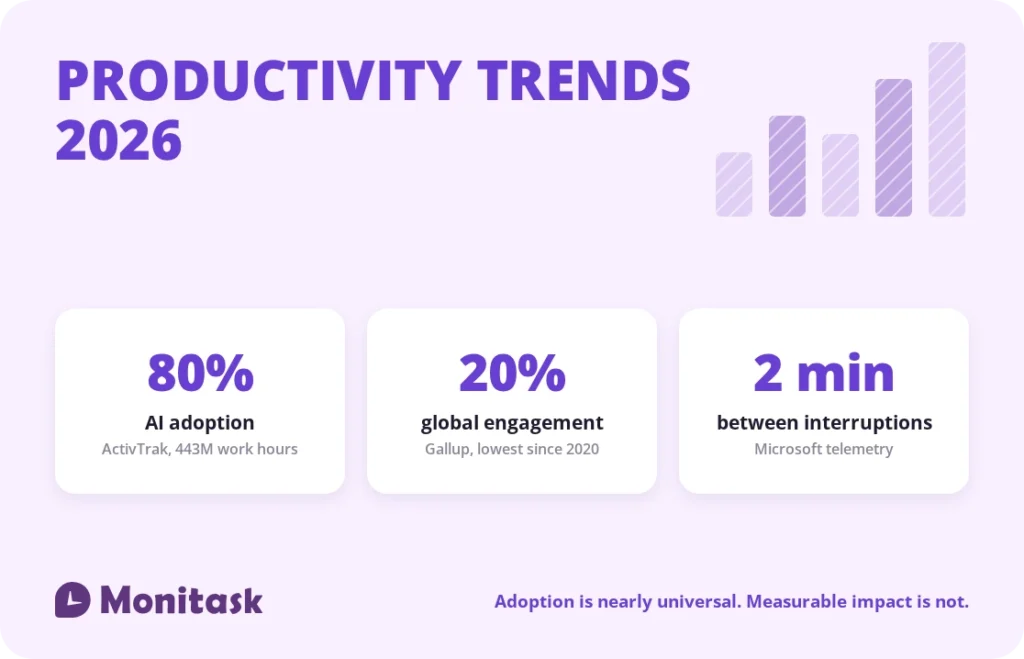
Adoption is close to universal. Behavioural data from ActivTrak covering 443 million work hours across 1,111 companies puts AI adoption at 80%. Yet a National Bureau of Economic Research survey of roughly 6,000 executives found that between 89% and 95% of firms saw no measurable impact on productivity or employment over the preceding three years.
That gap is the year. Everything below is either a cause of it or a consequence.
The numbers that matter
| Finding | Figure | Source |
|---|---|---|
| AI adoption among tracked employees | 80% | ActivTrak, 2026 |
| Firms reporting no measurable productivity impact from AI | 89-95% | NBER survey of ~6,000 executives |
| Global employee engagement | 20% | Gallup, 2025 reading |
| Estimated cost of disengagement | $10 trillion | Gallup |
| Interval between interruptions | 2 minutes | Microsoft telemetry |
| Employees describing their day as fragmented | 48% | Microsoft |
| Leaders describing their day as fragmented | 52% | Microsoft |
| Fall in resignations on a hybrid schedule | 33% | Stanford SIEPR |
| Daily productive time, remote-only workers | 7h 01m | ActivTrak |
| Focus efficiency, office-only workers | 64% | ActivTrak |
| Workers who received low-quality AI output in the past month | 40% | Stanford and BetterUp |
Trend 1: The productivity paradox
The gains from AI are measurable at the task level and invisible at the organisational one. Individual workers report saving a few percent of their weekly hours. Those savings do not aggregate into anything a CFO can see.
The reason is structural rather than technological. Time saved on a task returns to the same fragmented day it came from. Twenty minutes freed from drafting does not become twenty minutes of deep work; it becomes twenty more minutes of messages, or it is absorbed by the next interruption. Without a change to how work is organised, faster inputs produce the same output.
Organisations closing the gap are doing something specific: redesigning a workflow end to end rather than adding a tool to each step. That is slower and less demonstrable than a licence rollout, which is why most have not done it.
Trend 2: The workday is shorter but more fragmented
ActivTrak’s three-year behavioural dataset shows the workday getting shorter while productive hours rise. That sounds unambiguously good until you look at what happened to focus, which is eroding across the same period.
Microsoft’s telemetry supplies the mechanism. Employees are interrupted by a meeting, message or notification roughly every two minutes. Forty-eight percent of employees and 52% of leaders describe their own working day as chaotic and fragmented.
Note which figure is higher. Leaders report more fragmentation than the people they manage, which is worth sitting with, because leaders are also the ones setting meeting culture.
Compressed and more productive but less focused is a coherent picture: more is being completed, less of it is the kind of work that requires sustained attention.
Trend 3: Engagement fell to a five-year low
Gallup’s global reading put employee engagement at 20%, the lowest since 2020, with an estimated $10 trillion in associated lost productivity.
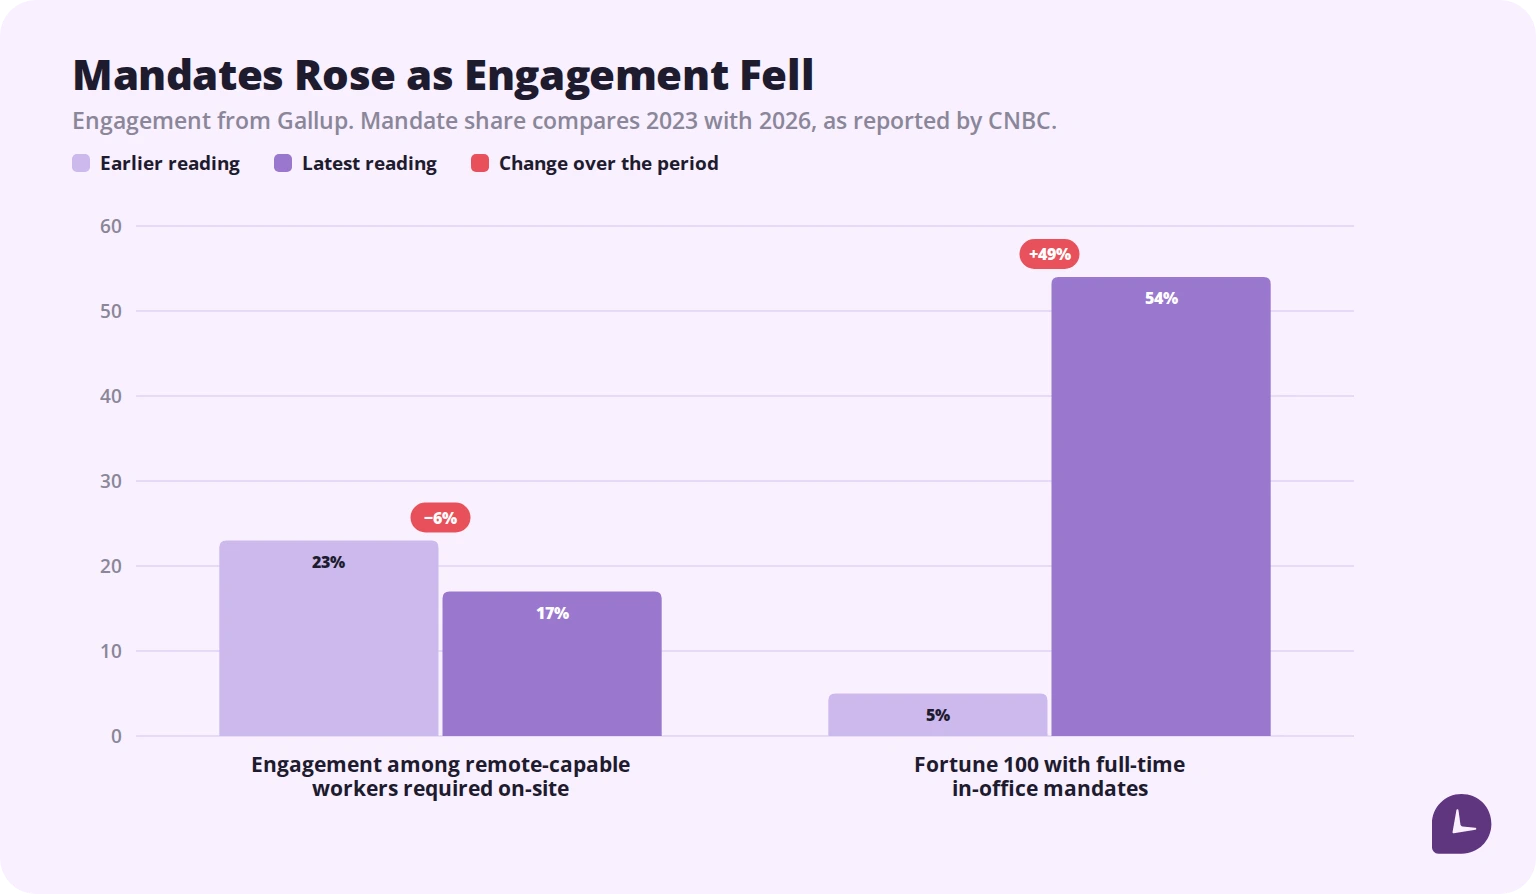
The subgroup figure is more instructive than the headline. Among remote-capable workers required to be on-site, engagement fell from 23% to 17%. The steepest decline is concentrated in exactly the population whose flexibility was available and removed.
That is a different finding from “remote workers are more engaged.” It says the loss of an existing arrangement damages engagement more than the arrangement itself ever helped.
Trend 4: Mandates moved against the evidence
In February 2026 the Stanford Institute for Economic Policy Research reported that resignations fell 33% among workers moved to a hybrid schedule, with no measurable drop in performance.
In the same period, full-time in-office mandates among Fortune 100 companies rose from 5% in 2023 to 54%.
Both facts are well evidenced and they point in opposite directions. Whatever is driving the mandates, published productivity research is not it.
For anyone planning workforce policy, the practical reading is that this decision is being made on grounds other than measured output, and it should be argued on those grounds rather than by presenting more productivity data to people who are not using it.
Trend 5: No work model wins outright
ActivTrak’s location breakdown resists the simple headline everyone wants:
- Remote-only workers log the highest daily productive time, at 7 hours 1 minute.
- Office-only workers show the highest focus efficiency, at 64%.
- Split-day hybrid workers, those who work part of a single day in each location, span the longest workdays yet record the lowest productive and focused time of any group.
That third finding is the useful one. The problem is not hybrid as such; it is splitting a single day across two locations. Commute time lands in the middle of the day, context switches twice, and the day stretches without filling.
Full days in one place, in whatever mix suits the role, avoid the penalty. Half-days do not.
Trend 6: Workslop
Researchers at Stanford and BetterUp put a name to a problem 2026 produced: 40% of workers received AI-generated content in the past month that was unhelpful, low-effort or low-quality.
The mechanism is a transfer of effort rather than a saving of it. Generating a mediocre document takes seconds; the recipient then spends real time working out what it was supposed to say. Time saved by the sender is spent, with interest, by the reader. At the level of the individual it looks like a productivity gain. At the level of the organisation it is a cost.
This is a large part of why task-level savings do not aggregate.
Trend 7: AI use is stratified by seniority
SHRM surveyed 5,875 US workers in March and April 2026 and found AI involvement rising sharply with seniority: 34% of work for individual contributors, 50% for managers, 63% for directors and above.
That inversion is worth noting, because the tasks most amenable to automation sit lower in the organisation, not higher. Adoption is being led by the people with the most discretion over their own time rather than the people with the most automatable work.
It suggests the constraint on adoption is permission and autonomy rather than capability, which is a management problem with a management solution.
Trend 8: Weekend work became structural
ActivTrak’s data describes weekend work as having become structural rather than exceptional. Combined with a shorter but more fragmented weekday, the shape is recognisable: work that cannot be completed inside a fractured day migrates to the days without meetings.
Burnout indicators fell over the same period while disengagement rose. Those two moving in opposite directions is unusual and probably the year’s most under-discussed finding. It describes a workforce that is less exhausted and less invested, which is not obviously an improvement.
What to do with this
Measure the workflow, not the tool. Licence counts and adoption rates say nothing about output. Pick one process, measure its cycle time before and after, and you will learn more than any adoption dashboard will tell you.
Protect blocks, not hours. If interruptions arrive every two minutes, adding headcount or hours changes nothing. Contiguous time is the scarce input.
Stop splitting days. If people are hybrid, give them whole days in one place. The split-day pattern is the one the data penalises.
Treat AI output as a draft, not a deliverable. Sending unreviewed generated work moves cost downstream and consumes the saving.
Look at the distribution, not the average. Team averages hide the fragmented individuals inside them, and those are the people to help.
Boost your business productivity
Track performance and streamline teamwork
How to read productivity statistics
Half of what circulates as productivity research in 2026 will not survive contact with a footnote. Four questions to ask:
Survey or behaviour? Self-reported time savings and observed time savings differ substantially. ActivTrak’s figures come from tracked hours; most vendor statistics come from surveys of people estimating their own productivity.
Who funded it? A tool vendor reporting that its category delivers large gains is not disqualifying, but it is not independent either.
What is the denominator? “91% of businesses use AI” counts any use anywhere in the company, including one person trialling one tool.
How old is it? Figures from 2024 are widely recirculated as current. Check the underlying study date rather than the article’s publication date.
How Monitask helps
Every finding above rests on measured behaviour rather than opinion, and most organisations cannot produce that measurement for themselves.
Monitask records how time is actually spent. Employees clock in when they start and clock out when they stop, so nothing runs in the background without their knowledge.
- Focus and idle time show whether a shorter day is a more productive one or a more fragmented one.
- Application and website reporting shows where the day goes, which is the input the fragmentation finding depends on.
- Project-level time measures workflow cycle time, the metric that separates real gains from adoption statistics.
- Trends over months turn a one-off observation into a baseline you can act on.
See how it works: Monitask productivity reporting.
Sources
- ActivTrak, State of the Workplace 2026 — behavioural data covering 443 million work hours across 1,111 companies and 163,638 employees over three years.
- Gallup, State of the Global Workplace 2026 — global engagement at 20% and the associated productivity cost.
- Stanford Institute for Economic Policy Research, February 2026 — 33% reduction in resignations under hybrid schedules with no measured performance decline.
- Microsoft, New Future of Work Report 2025 — interruption interval and fragmentation figures drawn from Microsoft 365 telemetry.
- National Bureau of Economic Research — executive survey finding no measurable productivity or employment impact at 89-95% of firms.
- SHRM, Navigating AI in the Workplace 2026 — survey of 5,875 US workers conducted in March and April 2026.
- Stanford and BetterUp — research identifying low-quality AI output received by 40% of workers.
Figures are as published by each organisation. Where this article reports a finding from secondary coverage rather than the primary report, the underlying study is named so it can be checked directly.
Related reading
- How to Calculate Productivity: A Comprehensive Guide
- Measure Employee Productivity
- What Is Deep Work? Understanding the Concept and Its Impact
- Are Remote Employees More Productive?
- Best Practices for a Hybrid Office
- Top Management Strategies That Drive Productivity
FAQ
Has AI improved workplace productivity?
At the task level, yes. At the organisational level, mostly not yet. An NBER survey of around 6,000 executives found 89–95% of firms saw no measurable impact on productivity or employment over three years.
What is the productivity paradox?
The gap between heavy technology investment and the absence of corresponding output gains. In 2026 it describes widespread AI adoption alongside flat measured productivity.
What is workslop?
AI-generated content that is unhelpful or low quality and transfers work to the recipient rather than saving it. Stanford and BetterUp researchers found 40% of workers received such content in the past month.
Are remote workers more productive than office workers?
They log more productive time per day, at 7 hours 1 minute in ActivTrak’s data, while office-only workers show higher focus efficiency at 64%. No model leads on every measure.
Which work model performs worst?
Split-day hybrid, where an employee works part of a single day in each location. Those workers have the longest workdays and the lowest productive and focused time.
How often are employees interrupted at work?
Roughly every two minutes by a meeting, message or notification, according to Microsoft telemetry.
What is employee engagement in 2026?
Gallup put global engagement at 20%, the lowest since 2020, with around $10 trillion in associated lost productivity.
Do return-to-office mandates improve productivity?
Published research does not support it. Stanford found hybrid schedules cut resignations by 33% with no measurable performance decline, while full-time office mandates among Fortune 100 firms rose from 5% to 54%.