Time Tracking for Designers: How to Estimate Creative Work

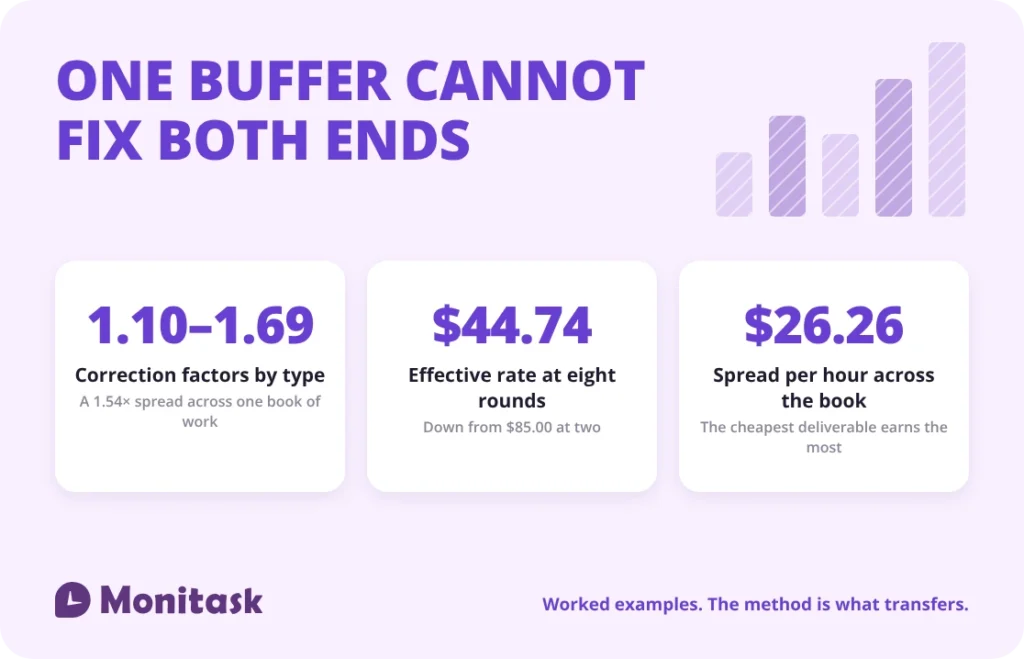
Designers track time to fix estimates, not to prove hours. The method is a ratio: record actual hours against the estimate for each type of deliverable, and use that type’s ratio to correct the next quote. A single overall buffer does not work, because the gap between estimate and actual varies by roughly 1.54× across deliverable types. The figures below are worked examples; the method is what transfers.
Key takeaways
- Correction factors belong to deliverable types, not to a designer. In the worked set below they range from 1.10 to 1.69.
- A flat buffer applied to the whole book under-quotes the worst category by 4.6 hours on a single job.
- Each unbudgeted revision round erodes the effective rate: from $85.00 at two rounds to $44.74 at eight.
- The cheapest item in a price list can be the most profitable per hour — in this set, a $900 deliverable beats a $1,500 one by $26.26 an hour.
- Shaving a 20-hour job to 12 hours cuts an hourly invoice by $680.00; the same 8 hours raise the effective rate 66.7% under a fixed fee.
Why is design time so hard to estimate?
Because design hours are not proportional to output. A logo that takes 29 hours is not more logo than one that takes 14; the hours went into exploring directions that were discarded, and the discarded work is what made the chosen direction defensible. Nothing in the deliverable records that effort, so there is no artefact to estimate from.
Three properties make the problem worse than it is in most project work. The quantity of work is set partly by the client, through the number of feedback rounds, after the price is agreed. The work is non-linear: the first direction can take two hours or two days, and that is not knowable at the quoting stage. And the same nominal deliverable varies enormously in scope — a brand guideline document can be eight pages or eighty.
None of that makes estimation impossible. It makes estimation empirical: the only reliable input is what the same type of work actually took last time, which is the one number most design practices do not have.
What does switching between design tools cost?
The research on task switching is more specific, and more useful, than the figure usually quoted from it.
The underlying study is Rubinstein, J. S., Meyer, D. E., & Evans, J. E. (2001). “Executive Control of Cognitive Processes in Task Switching.” Journal of Experimental Psychology: Human Perception and Performance, 27(4), 763–797. Across 4 experiments, University of Michigan undergraduates in introductory psychology courses switched between tasks — two experiments had participants classify geometric objects under alternative classification rules, and two had them solve arithmetic problems under alternative numerical operations — and the cost of switching was measured by comparing response times on blocks where participants alternated between tasks against blocks where they repeated one task.
The measured cost is about a second per switch, not a fraction of one. In the first experiment the mean switching-time cost was 975 ms (SE = 71 ms), and moving from a low-complexity to a high-complexity classification rule added a further 823 ms on average (SE = 128 ms). Those are the paper’s own figures, and they are the strongest numbers available on this question.
Two of the findings bear directly on design work:
| Finding | Why it applies to design |
|---|---|
| Switching costs “increased with rule complexity but decreased with task cuing” | Design tasks are complex by nature, so the cost sits at the high end rather than the average |
| “rule activation takes more time for switching from familiar to unfamiliar tasks” | Much design work is unfamiliar by definition — a new brand, a new product, a new constraint |
The 40% figure is not a result
This needs stating precisely, because it is almost always reported wrongly. The widely quoted figure of 40% of productive time comes from the American Psychological Association’s own explainer page, which attributes it as a remark: “Meyer has said that even brief mental blocks created by shifting between tasks can cost as much as 40 percent of someone’s productive time.”
It is reported speech, in the page’s interpretive section, attached to no study at all. The figure appears nowhere in the paper, which expresses no cost as a percentage of time and does not discuss workplace productivity; nor does it appear in the APA’s own 2001 write-up of the experiments. It is a researcher’s statement about scale, and it has been repeated as a measured finding for twenty years.
So the honest position is this. The direction of the effect is established, the per-switch cost is measured in the high hundreds of milliseconds, and it rises with exactly the two properties design work has. But no percentage of a working day can be derived from the study, because scaling a per-switch cost into a share of a day depends entirely on how often you switch, and nobody has measured that for design work.
What can be measured is the number of switches, and that is a figure time tracking produces directly. A tracked day that shows 60 tool switches and one that shows 12 are different working days, and the comparison is available without needing to put a percentage on it.
How do you build an estimate from past projects?
Record the estimate and the actual for every job, group by deliverable type, and divide. The ratio is the correction factor for that type.
| Deliverable type | Estimated hours | Actual hours | Difference | Correction factor |
|---|---|---|---|---|
| Logo and identity | 20 | 29 | +9 | 1.45 |
| Landing page design | 35 | 41 | +6 | 1.17 |
| Brand guidelines | 24 | 38 | +14 | 1.58 |
| Social template set | 10 | 11 | +1 | 1.10 |
| Pitch deck design | 16 | 27 | +11 | 1.69 |
| Total | 105 | 146 | +41 | 1.39 |
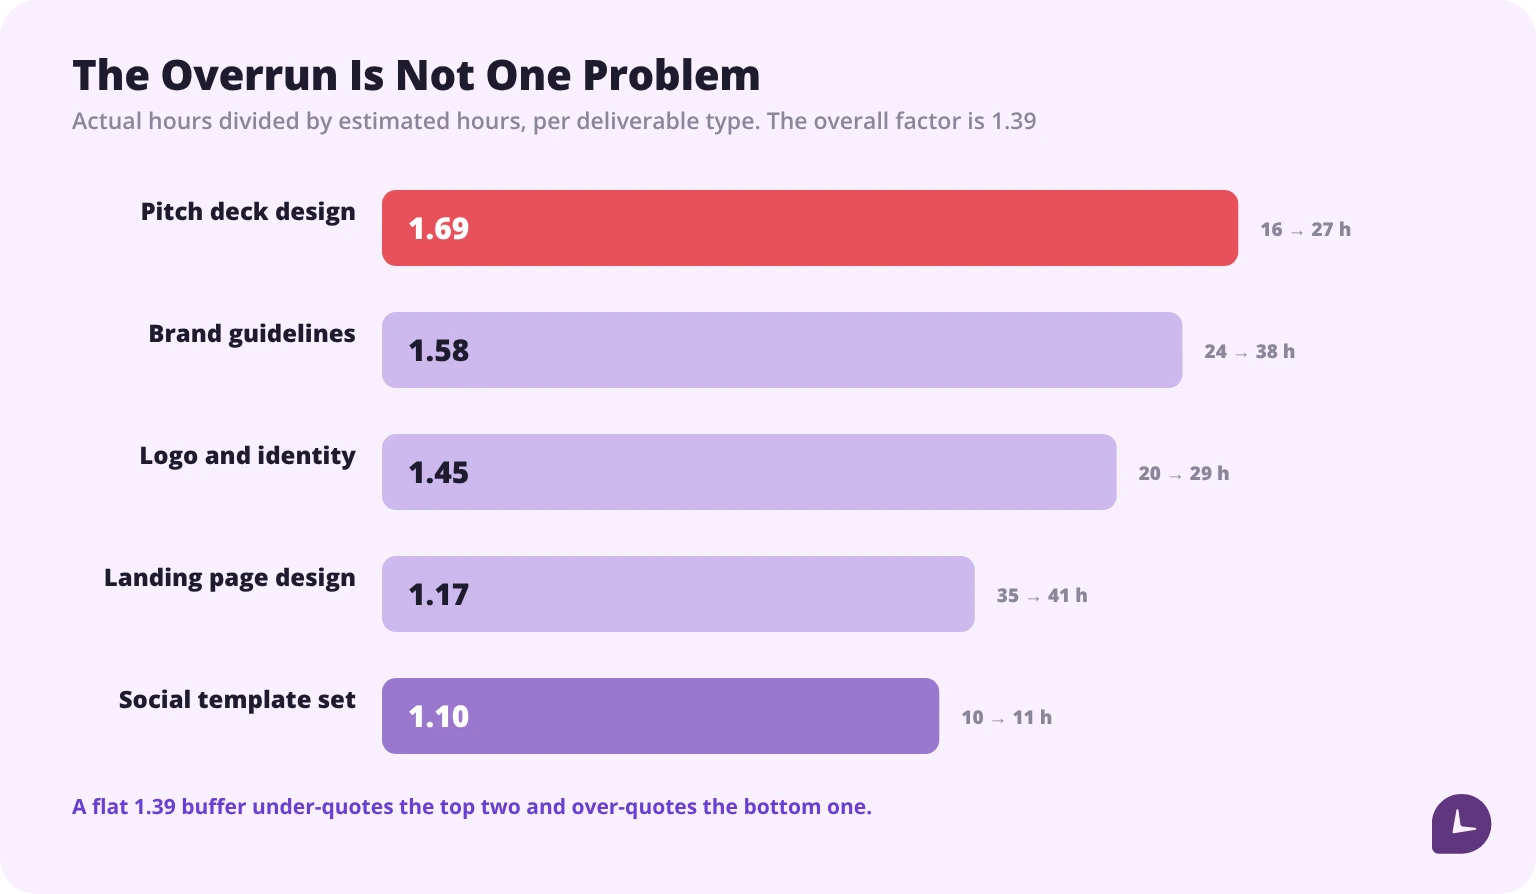
The overall overrun is 39.0%, which is the number most practices would stop at. The useful information is in the spread: the factors run from 1.10 to 1.69, a range of 1.54×, and they point in opposite directions. Social templates are nearly accurate. Pitch decks and brand guidelines are badly under-quoted. A designer who knows only the 39.0% figure knows that quotes are low, but not which quotes.
Three rules keep the factors honest. Group by deliverable type rather than by client, because the type is what repeats. Keep the estimate recorded as it was given, not as it was revised mid-project, or the ratio measures nothing. And use a minimum of three completed jobs per type before trusting a factor — one job gives an anecdote, and the first job of a new type is always the worst case. Project time tracking covers the record this method reads from.
Why does a flat buffer not work?
Because it is an average of numbers that are not alike. Take the next job as brand guidelines, naively estimated at 24 hours:
| Method | Quoted hours | At $85.00/hour | Miss |
|---|---|---|---|
| No correction | 24.0 | $2,040.00 | −14.0 h |
| Overall factor, 1.39 | 33.4 | $2,839.00 | −4.6 h |
| Type factor, 1.58 | 37.9 | $3,221.50 | −0.1 h |
| What it actually took | 38.0 | — | — |
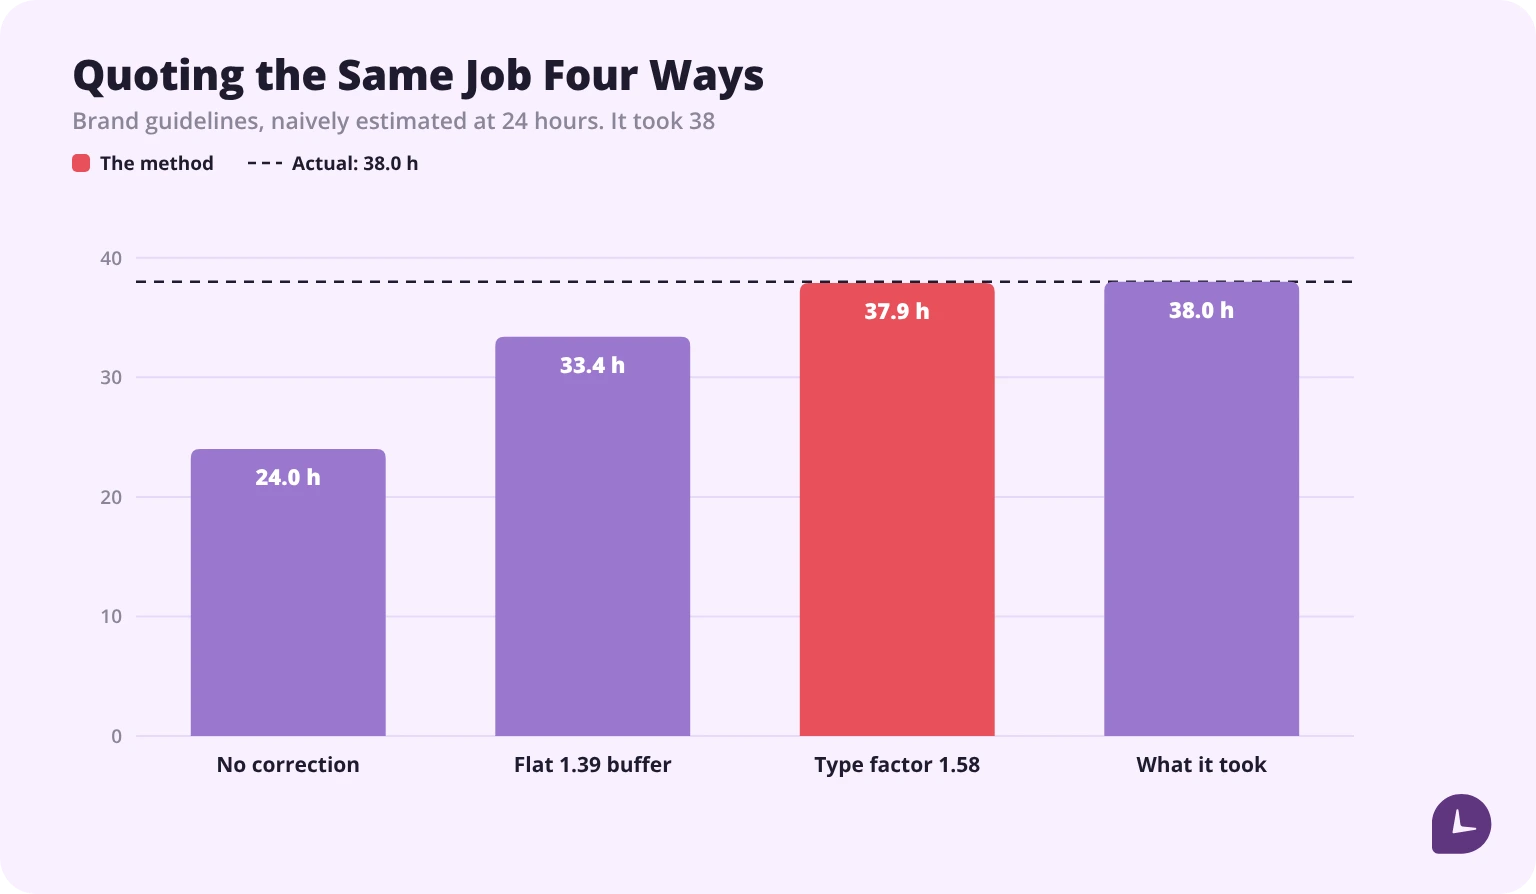
The overall factor under-quotes by 4.6 hours. The type factor misses by 0.1 — forty-six times closer. On this one job the difference in the quote is $382.50.
Applied across the book, the flat buffer is wrong twice over. It under-quotes pitch decks and brand guidelines, where the real factors are 1.69 and 1.58, so those jobs continue to lose money with a buffer in place. And it over-quotes social templates, where the real factor is 1.10, which makes the cheapest and most competitive item in the price list less competitive for no reason. One number cannot correct two errors that run in opposite directions.
How many revision rounds should an estimate include?
As many as the type actually takes, which is a tracked figure rather than a hopeful one. The arithmetic of getting it wrong is severe because revision hours arrive after the price is fixed, which is scope creep with a number attached.
| Rounds budgeted | 2 at 3 hours = 6 hours |
| Rounds actually used | 5 at 3 hours = 15 hours |
| Overrun | 9 hours = $765.00 |
| Share of a $1,700.00 fee | 45.0% |
The effect on the effective rate, on a $1,700.00 fixed fee with 20 base hours:
| Rounds | Total hours | Effective hourly rate |
|---|---|---|
| 2 | 20 | $85.00 |
| 3 | 23 | $73.91 |
| 4 | 26 | $65.38 |
| 5 | 29 | $58.62 |
| 6 | 32 | $53.13 |
| 7 | 35 | $48.57 |
| 8 | 38 | $44.74 |
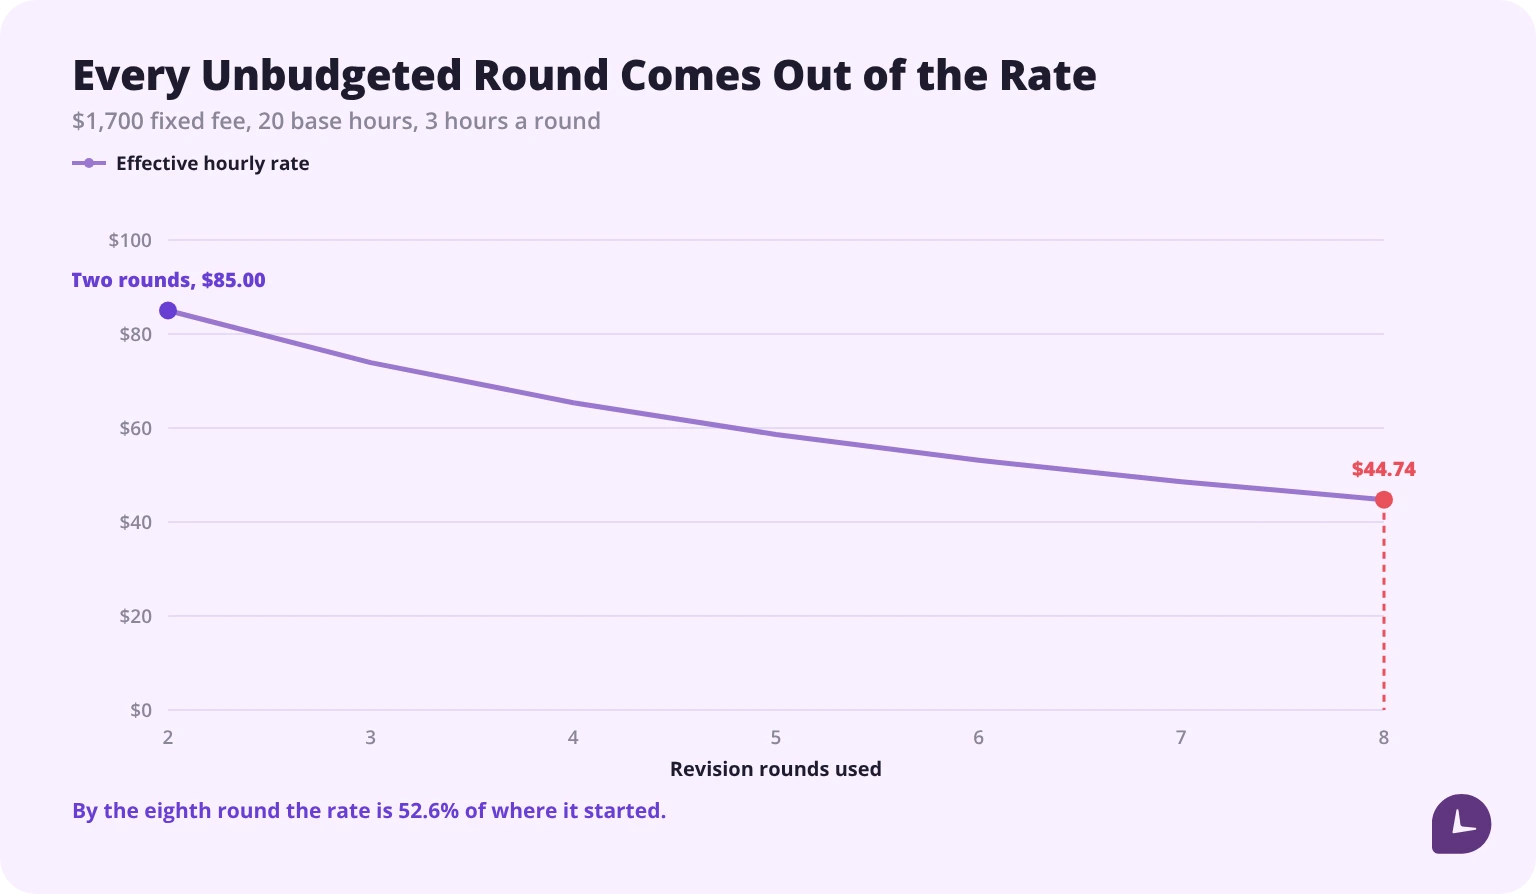
By the eighth round the effective rate is $44.74, or 52.6% of where it started. The curve is the argument for tracking rounds as a field rather than as a feeling: a designer who knows that pitch decks average five rounds and social templates average two prices them differently, and prices both correctly.
Which deliverables are actually profitable?
Divide the fixed price by the hours it actually took. The ranking is usually not the ranking by fee.
| Deliverable type | Price | Actual hours | Effective hourly rate |
|---|---|---|---|
| Social template set | $900.00 | 11 | $81.82 |
| Landing page design | $3,200.00 | 41 | $78.05 |
| Brand guidelines | $2,400.00 | 38 | $63.16 |
| Logo and identity | $1,700.00 | 29 | $58.62 |
| Pitch deck design | $1,500.00 | 27 | $55.56 |
| Best | Social template set, $81.82/hour |
| Worst | Pitch deck design, $55.56/hour |
| Spread | $26.26/hour, or 1.47× |
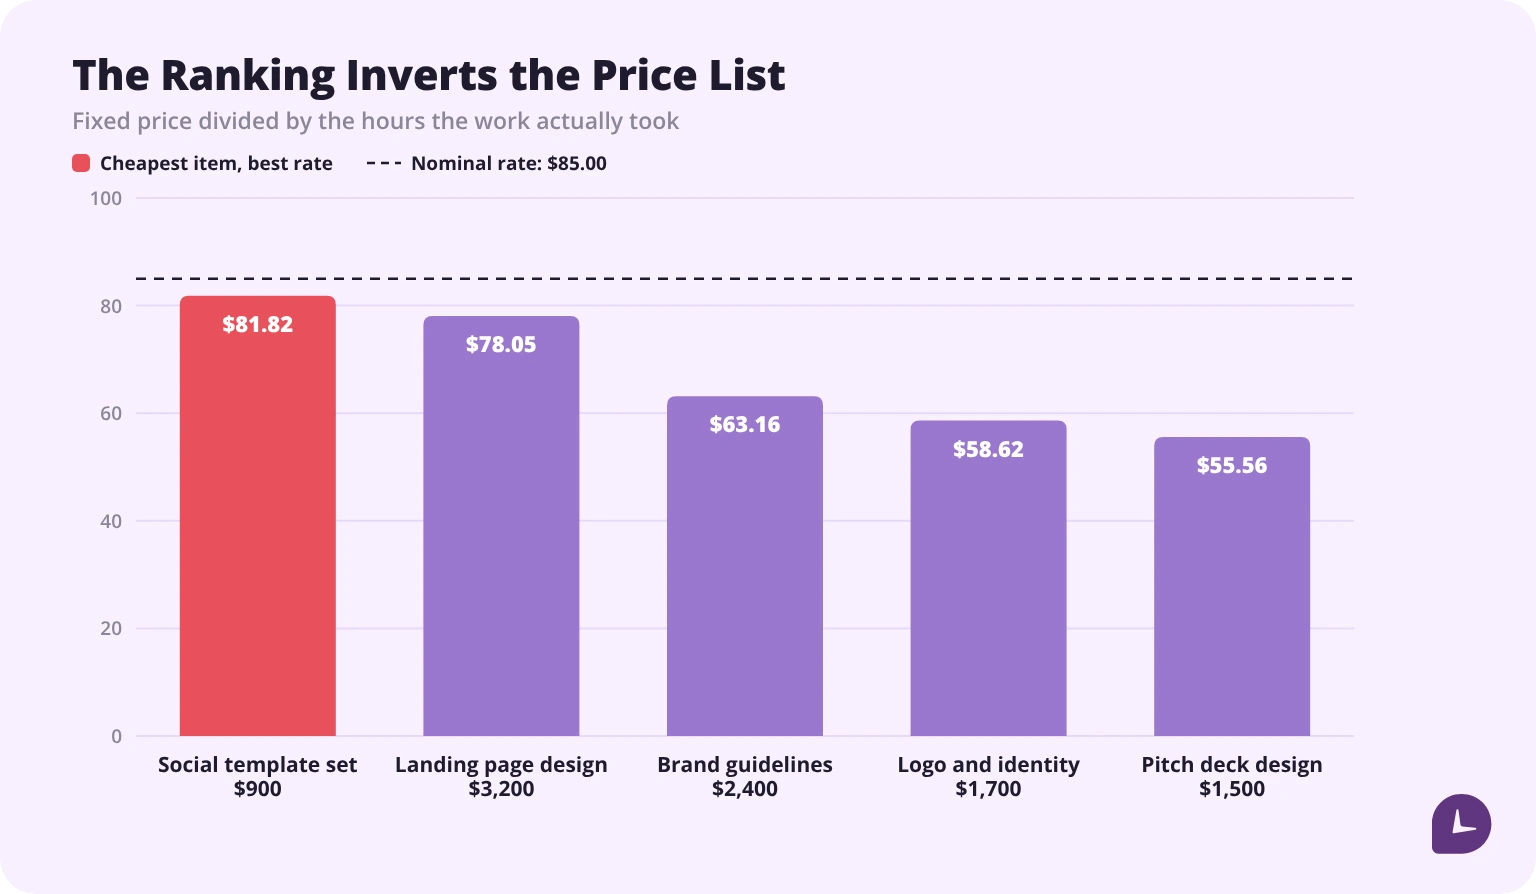
The result inverts the price list. The cheapest deliverable here is the most profitable per hour, and a job priced at $1,500.00 earns less per hour than one priced at $900.00. A designer choosing work by fee size is systematically choosing badly, and nothing short of recorded hours reveals it.
What to do with the ranking is a commercial decision rather than an arithmetic one. The low performers are not automatically work to drop — a pitch deck may be the entry point to a larger engagement, and a loss-leader held deliberately is a strategy. The distinction that matters is between a loss-leader you chose and one you have been running by accident.
Does hourly billing punish getting faster?
Directly, and the size of the penalty equals the size of the improvement.
| Rate | $85.00/hour |
| Original time for the job | 20 hours |
| Billed hourly at 20 hours | $1,700.00 |
| Billed hourly at 12 hours | $1,020.00 |
| Revenue lost by improving | $680.00, or 40.0% |
| Fixed fee of $1,700.00 at 20 hours — effective rate | $85.00 |
| Fixed fee of $1,700.00 at 12 hours — effective rate | $141.67 |
| Effective rate gained by improving | +$56.67, or +66.7% |
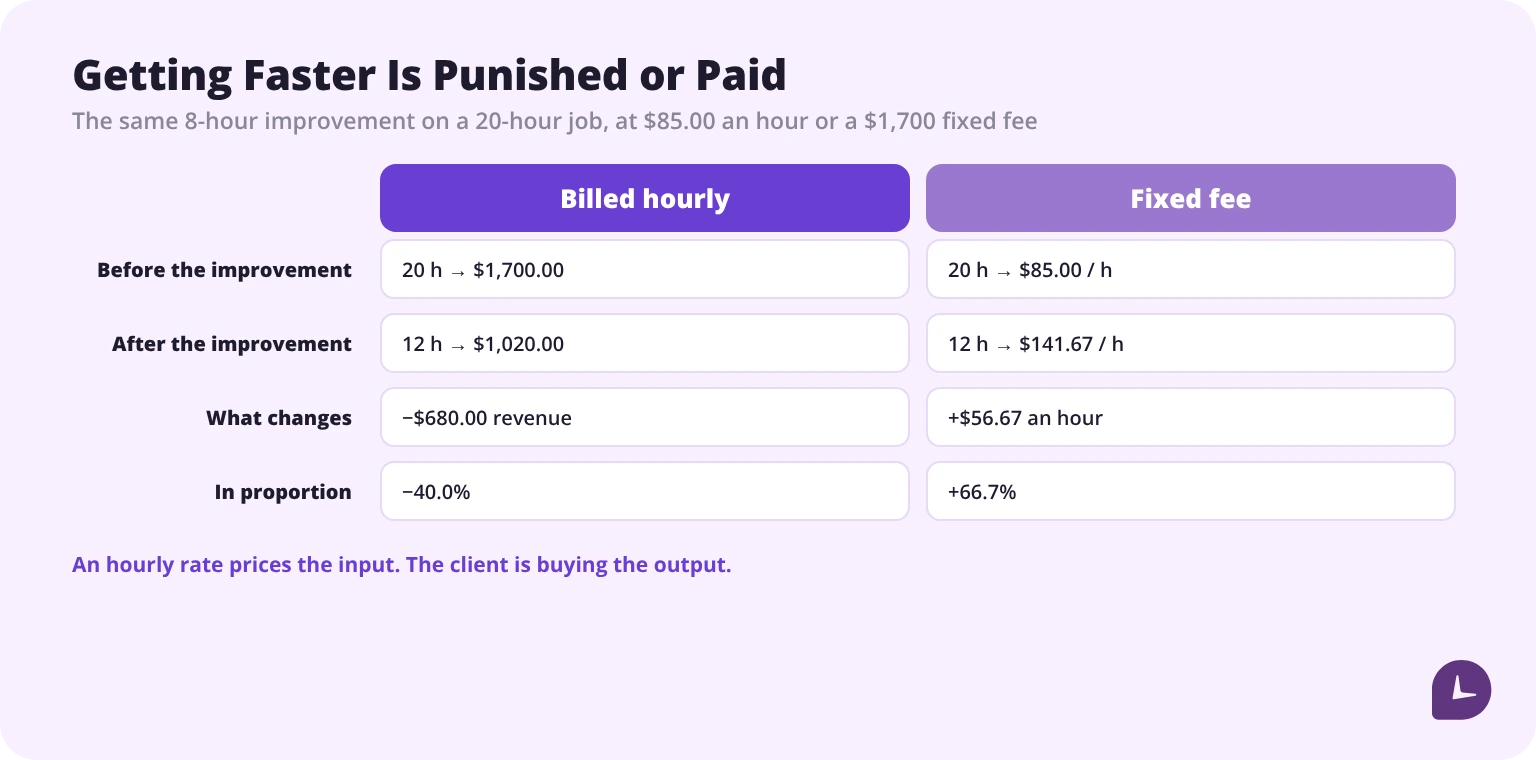
The same 8 hours of improvement — a better process, a reusable component library, more experience with the tool — produces a 40.0% revenue cut under hourly billing and a 66.7% rise in the effective rate under a fixed fee. This is the structural reason experienced designers move off hourly rates, and it has nothing to do with wanting to hide hours. An hourly rate prices the input; the client is buying the output. The same logic applies to anyone billing their own time, which is why it shows up early in freelance practice.
Tracking time does not contradict a fixed fee. It is what makes a fixed fee safe to offer, because the fee has to be set from known hours. Billing by the project and tracking by the hour are the same practice seen from two ends.
Should designers bill by the hour or by the project?
| Hourly | Fixed fee | |
|---|---|---|
| Rewards speed | No — faster means less revenue | Yes — faster raises the effective rate |
| Risk of scope growth | Carried by the client | Carried by the designer |
| Needs accurate estimates | No | Yes, absolutely |
| Client’s view of the price | Open-ended | Known before work starts |
| Suits exploratory work | Yes | Only with a defined phase |
| Suits repeatable deliverables | Poorly | Well |
| What tracking is for | Producing the invoice | Setting and correcting the price |
The practical division most practices land on is phase-based: an exploratory or discovery phase billed hourly or as a small fixed block, because its scope genuinely is not knowable, and the production phases fixed once the direction is agreed. That requires a correction factor per phase as well as per deliverable, which is the same method applied at a finer grain.
What should a designer actually track?
| Field | Why |
|---|---|
| Deliverable type | The unit the correction factor belongs to |
| Estimated hours, as quoted | Without the original estimate there is no ratio |
| Actual hours | The other half of the ratio |
| Project phase | Concept, production, revision, delivery — so overruns can be located |
| Revision round number | Turns rounds from an impression into a budgetable figure |
| Client | Reveals which clients run long, independently of deliverable type |
| Billable or not | Separates client work from admin, pitching and self-directed work |
| Tool or file | Shows where the hours physically went within a phase, and how often you switched between them |
| Fixed price, where applicable | Needed to compute the effective rate |
The two fields most often missing are the estimate as originally quoted and the revision round number. Without the first, nothing can be corrected; without the second, the largest single source of overrun stays invisible inside a general “design” total. If you are starting from paper, the weekly timesheet templates have the columns to add.
How do you track time without breaking flow?
The objection designers raise is real: stopping to start a timer interrupts the thing being tracked, and the interruption is worst exactly when the work is going well. Designers regularly ask for tracking inside the design tool itself for this reason.
Three approaches reduce the friction, and they differ in what they cost:
| Approach | What it gives | What it costs |
|---|---|---|
| Timer started once per work block | Clean start and stop around a session | Breaks if the session is interrupted and the timer runs on |
| Automatic capture, reviewed later | A timeline to assign afterwards, with no in-session action | Requires a review habit, and the record is only as good as the assignment |
| End-of-day reconstruction | No interruption at all | Least accurate, and the figures feeding the estimates are the ones that suffer |
The one that matters for this method is the second, because the estimate correction needs the hours attributed to a deliverable type, and attribution is a review task rather than a timing task. A designer who captures automatically and spends a few minutes a day assigning blocks gets usable factors. A designer who reconstructs from memory on Friday gets factors built on recall, which is where the original estimation error came from.
Two practical notes. Track at the grain you will actually use — per phase and per deliverable is enough for the method above, and per keystroke is not. And keep the estimate field filled at quoting time, before the work begins, because it cannot be reconstructed afterwards without bias.
Monitask records hours against projects and tasks and reports them by type, so the actual-against-estimate figures the method above needs come out of a report rather than out of memory.
See time tracking for designers
Sources
- Rubinstein, J. S., Meyer, D. E., & Evans, J. E. (2001). “Executive Control of Cognitive Processes in Task Switching.” Journal of Experimental Psychology: Human Perception and Performance, 27(4), 763–797.. https://doi.org/10.1037/0096-1523.27.4.763
- “Multitasking: Switching costs.” American Psychological Association, created March 2006. https://www.apa.org/topics/research/multitasking
All sources checked 22 October 2026. The American Psychological Association page was created in March 2006 and carries no revision date.
FAQ
Why do design estimates run over so consistently?
Because design hours are not proportional to the deliverable, the number of feedback rounds is partly set by the client after the price is agreed, and the same nominal deliverable varies widely in scope. In the worked example above, five deliverable types overran by 39.0% in total, but the individual factors ranged from 1.10 to 1.69 — so the overrun is not one problem but several of different sizes.
Should I add a flat buffer to every design estimate?
No. A flat buffer averages categories that behave differently, so it under-quotes the worst ones and over-quotes the best. In the example above, applying the overall 1.39 factor to a brand guidelines job quoted 33.4 hours against an actual 38 — short by 4.6 hours and $382.50 — while the type factor of 1.58 came within 0.1 of an hour.
How many revision rounds should I include in a quote?
As many as that deliverable type has historically taken, which is why the round number belongs in the tracked data. The cost of getting it wrong compounds: on a $1,700.00 fixed fee with 20 base hours and 3 hours per round, the effective rate falls from $85.00 at two rounds to $58.62 at five and $44.74 at eight.
How do I know which design work is profitable?
Divide each fixed price by the hours the work actually took. The ranking rarely matches the ranking by fee — in the set above the $900.00 social template package returned $81.82 an hour while the $1,500.00 pitch deck returned $55.56, a spread of $26.26 an hour or 1.47×. Only recorded hours surface that inversion.
Does billing hourly cost designers money as they improve?
Yes, proportionally. At $85.00 an hour, improving a 20-hour job to 12 hours cuts the invoice from $1,700.00 to $1,020.00 — a loss of $680.00, or 40.0%. The same improvement on a $1,700.00 fixed fee raises the effective rate from $85.00 to $141.67, up 66.7%. An hourly rate prices the input while the client is buying the output.
Does tracking time conflict with charging a fixed price?
The opposite. A fixed fee can only be set safely from known hours, so tracking is what makes fixed pricing possible rather than a gamble. The difference is what the data is used for: under hourly billing it produces the invoice, and under fixed pricing it sets and corrects the price.
Does switching between design tools really cost that much time?
It costs about a second a switch, and the widely quoted 40% figure is not a study result. Rubinstein, Meyer and Evans (2001) measured a mean switching-time cost of 975 ms in their first experiment, rising by a further 823 ms with rule complexity, and found that costs were greater when switching to relatively unfamiliar tasks. The 40% figure comes from a remark by one of the researchers on an American Psychological Association explainer page, attached to no study, and it appears nowhere in the paper. Since design work is both complex and often unfamiliar the findings apply — but no percentage of a working day can be derived from them, because that depends on how often you switch. The measurable quantity is the number of switches in a day, which tracking gives you directly.
What should designers track besides hours?
The estimate as originally quoted, the deliverable type, the project phase, the revision round number, the client, whether the time is billable, and the fixed price where there is one. The estimate and the round number are the two fields most often missing, and without them overruns cannot be corrected or even located.
How can I track time without interrupting creative work?
Capture automatically and assign afterwards, rather than starting and stopping a timer in the middle of the work. Attribution to a deliverable type is a review task, not a timing task, so a few minutes a day spent assigning captured blocks produces usable figures. Reconstructing the week from memory on a Friday produces estimates built on recall, which is the source of the original error.