Project Planning: Building a Schedule That Survives Contact With the Calendar

Every guide to project planning describes the same sequence: define objectives, identify stakeholders, build a work breakdown structure, estimate, schedule, add a risk register. That sequence is correct and it is not where projects go wrong.
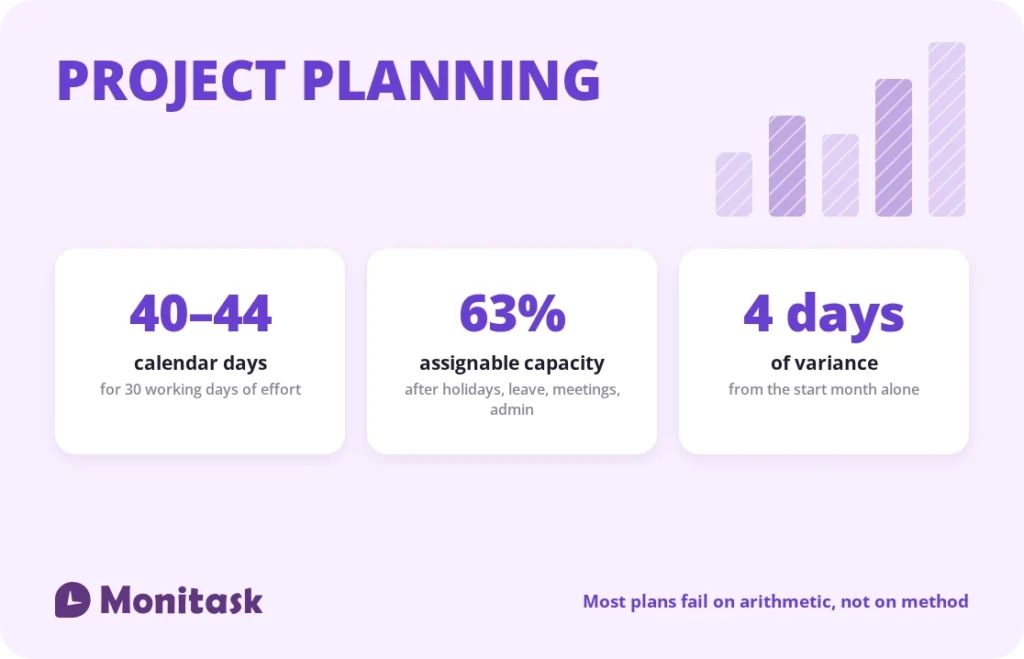
Projects go wrong in the conversion between effort and time. A team agrees a piece of work is 30 days of effort, someone writes “six weeks” in the plan, and the project lands late without anyone doing anything wrong. Thirty working days is between 40 and 44 calendar days depending on the month it starts, and that is before subtracting the leave, meetings and admin that consume roughly 30% of any team’s paid time.
This guide covers the standard sequence briefly and then spends its length on the part that determines whether the plan holds.
The planning sequence, briefly
The core steps are well established and worth stating once.
- Define the outcome. What is true when this is finished that is not true now. Not a list of activities.
- Identify stakeholders. Who decides, who is affected, who must be consulted before a decision sticks.
- Set scope, and set what is out of scope. The second list prevents more trouble than the first.
- Break the work down. A work breakdown structure to the level where a single person could own each item and estimate it honestly.
- Estimate effort. In person-days or person-hours, not in calendar time.
- Sequence the work. What must precede what. Everything else can move.
- Convert effort into a schedule. This is the step that fails, and the rest of this guide is about it.
- Identify risks and owners. A risk without a named owner is a note.
- Agree how progress is reported. Before the project starts, not after the first slip.
Steps one to six are covered adequately in most guides, including our own on writing a work plan and project milestones. Step seven is where this one diverges.
Effort is not duration
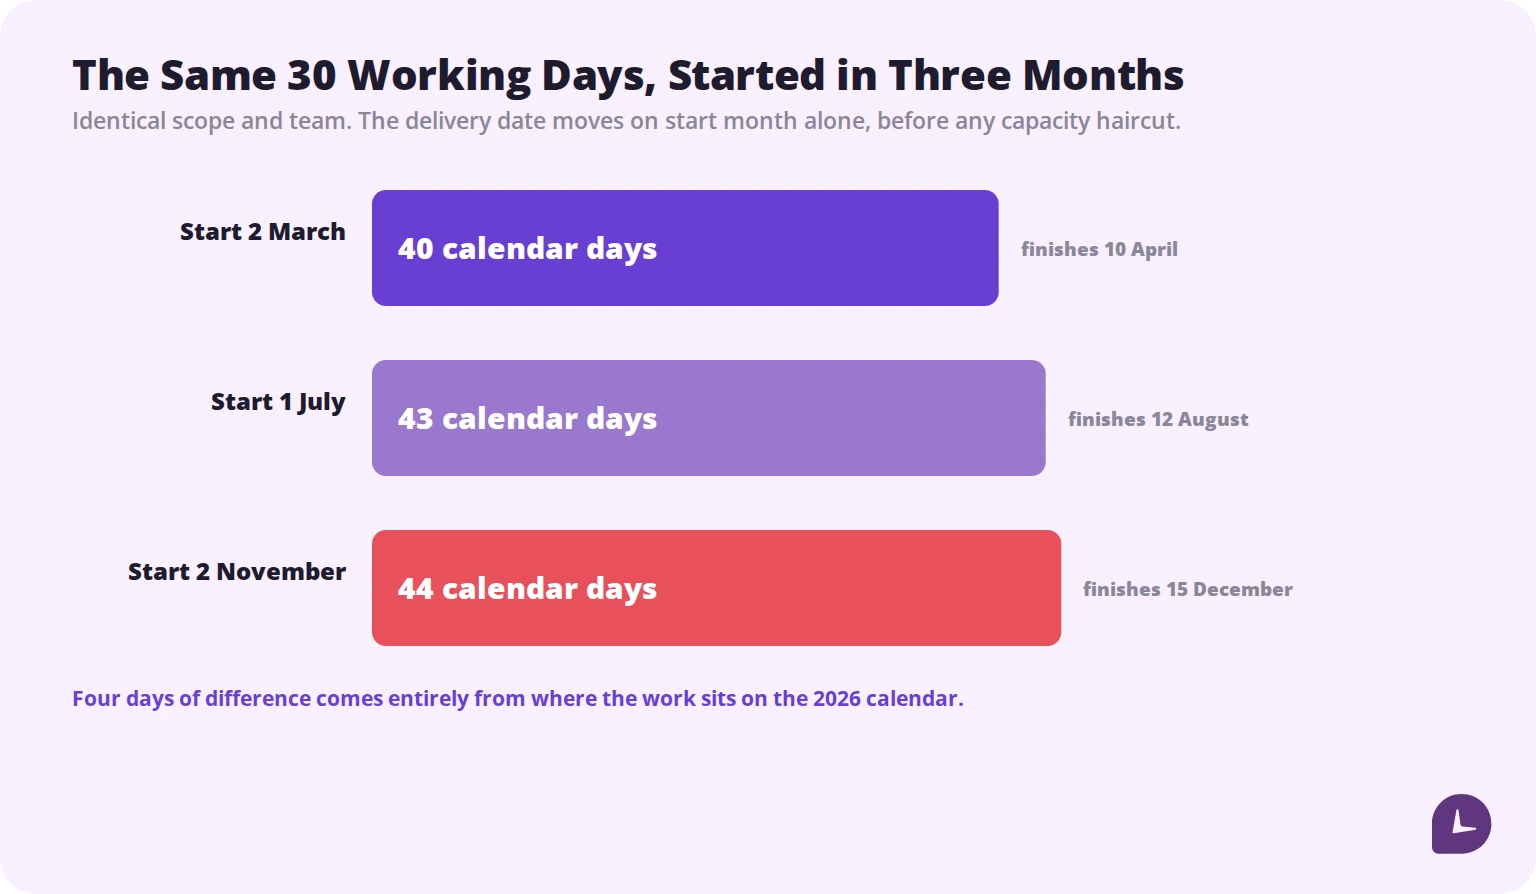
Thirty working days of effort in 2026:
- Starting 2 March, it finishes 10 April — 40 calendar days.
- Starting 1 July, it finishes 12 August — 43 calendar days.
- Starting 2 November, it finishes 15 December — 44 calendar days.
Nothing about the work changed. The difference comes entirely from weekends and public holidays falling differently, and from November holding only 19 working days against March’s 22.
Quarters differ too. In 2026 there are 61 working days in Q1, 63 in Q2, 64 in Q3 and 62 in Q4. A quarterly target that assumes the quarters are equal asks Q1 to do about 5% more per day than Q3.
The fix is mechanical. Estimate in working days, then map those onto a real calendar with the holidays marked, rather than converting to weeks in your head. Our breakdown of work days in a year has the month-by-month figures for 2026 and 2027.
The capacity haircut
The second conversion error is treating a person as a unit of project capacity. They are not, and the gap is large.
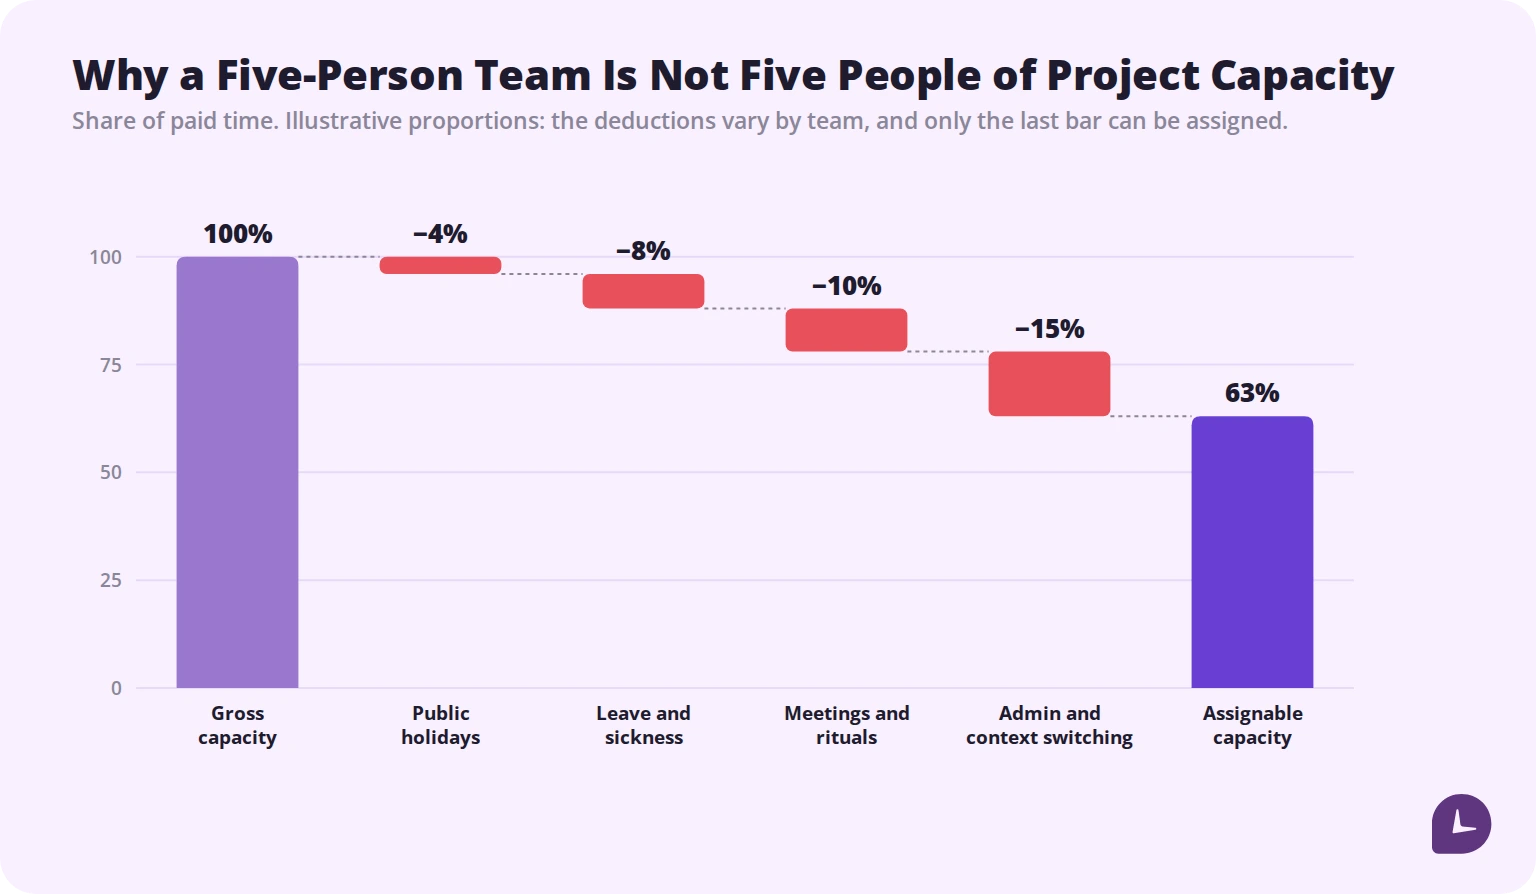
Starting from 100% of paid time, a typical knowledge-work team loses:
- Public holidays, around 4% of the year in the US
- Leave and sickness, commonly 8% once PTO and a realistic sick allowance are counted
- Meetings and standing rituals, which vary enormously but rarely fall below 10%
- Admin, context switching and interruptions, the largest and least visible category
What remains is assignable. For most teams that lands somewhere between 60% and 75% of gross capacity, and the honest number for your team is knowable only from recorded time.
Practically: five full-time people are not five person-months a month. They are closer to three. A plan built on five will be a third over from the day it is signed, and no amount of execution discipline recovers that.
This is also why adding people late rarely rescues a schedule. The new person consumes assignable capacity from the existing team before contributing any.
Estimating from history instead of optimism
Systematic underestimation of task duration is one of the better-documented findings in behavioural research. Kahneman and Tversky named it the planning fallacy: people predict how long their own work will take by imagining it going well, and their predictions cluster near the best case even when they have direct experience of similar work going badly.
Knowing about the bias does not fix it. Two things do.
Reference class forecasting. Instead of estimating this project from its details, find the class of similar past projects and take their actual distribution as the starting point. If your last four migrations took 9, 11, 14 and 12 weeks, the honest estimate for the fifth is not eight weeks because this one feels simpler. This method, associated with Bent Flyvbjerg’s work on large projects, consistently outperforms bottom-up estimation because it uses outcomes rather than intentions.
Recorded time as the reference class. Reference class forecasting needs data about what past work actually took, and most organisations do not have it. They have what was planned and what was invoiced, neither of which is the same thing. Recorded time by project and task turns “it felt like about three weeks” into a number.
The compounding benefit is that each project improves the next estimate. Teams that record time and compare estimate against actual get measurably better at estimating within a few cycles. Teams that do not repeat the same error indefinitely, because they never see it clearly.
Where to put the buffer
Almost every plan contains buffer. Most of it is in the wrong place.
The instinct is to pad each task: eight days of work becomes ten in the plan, repeated across every line. This fails for two reasons.
Parkinson’s law. Work expands to fill the time available. A task with two days of hidden slack finishes in ten days, not eight.
Student syndrome. Slack at task level is consumed at the start through delayed beginnings, so it is gone before the task encounters an actual problem.
The alternative, drawn from critical chain method, is to strip the padding out of individual estimates and pool it into a single project buffer at the end. Same total time, different behaviour: tasks are estimated at a realistic median rather than a defensive worst case, and the buffer absorbs variation across the whole project instead of being spent locally.
It also gives you a live signal. Buffer consumed against work completed is the earliest reliable indication that a project is drifting. Halfway through the work with 70% of the buffer gone is a problem visible weeks before any milestone slips.
Building the schedule
With effort estimated and capacity known, the schedule is arithmetic.
- Total the effort in person-days.
- Divide by assignable capacity, not headcount. Five people at 65% assignable is 3.25 person-days per working day.
- Convert to working days, then map onto the calendar with holidays and known leave marked.
- Apply the sequence constraints. Some work cannot start until other work finishes; that lengthens the calendar without changing the effort.
- Add the project buffer, sized against how variable this class of work has been for you historically.
- Read the finish date off the calendar, and sanity check it against the reference class. If the arithmetic says six weeks and every comparable project took ten, the arithmetic is missing something.
Step six matters. Bottom-up and reference-class estimates disagreeing is information, not an error to resolve by picking the one you prefer.
Boost your business productivity
Track performance and streamline teamwork
Tracking the plan once it is live
A plan is a hypothesis. Tracking is how you find out whether it was right, early enough to act.
Three signals are worth watching weekly:
Effort consumed against work completed. Not against elapsed time. Sixty percent of the budget spent on 40% of the scope is the number that matters.
Buffer consumption. As above, the earliest reliable warning.
Estimate accuracy by task type. Over a few projects, patterns appear. Most teams find one or two categories of work they systematically underestimate, often integration, review cycles and anything depending on someone outside the team.
That third one only becomes visible if estimates and actuals are both recorded against the same task. It is the single highest-return habit in project planning, and the one most teams skip.
Planning for distributed teams
Distributed work adds two planning considerations that co-located teams can ignore.
Overlap hours, not headcount. A team spread across three time zones may have only three hours of common working time. Anything requiring real-time collaboration is constrained by that window, not by total capacity. Plan collaborative work inside it and independent work outside.
Public holidays differ by country. A team split across the US, Poland and the Philippines has three separate holiday calendars. A plan built on one of them will be wrong about the others.
Our guide to remote project management covers the workflow side in more depth.
Common mistakes
Converting effort to calendar time in your head. Thirty working days is not six weeks in most months.
Planning against headcount. Five people is roughly three people of assignable capacity.
Estimating from the plan rather than from history. Your last four similar projects are better evidence than this one’s optimism.
Padding every task. The slack is consumed locally and the project gains nothing.
Treating quarters as equal. They differ by up to three working days.
Adding people to a late project. Onboarding consumes capacity from the team that is already behind.
Never comparing estimate to actual. Without that comparison, estimation cannot improve, and every project starts from the same optimism as the last.
How Monitask helps
Everything above depends on knowing what work actually took. Most organisations know what was planned and what was billed, which is not the same thing.
Monitask records time as it is spent. Employees clock in when they start and clock out when they stop, so nothing runs in the background without their knowledge.

- Project and task time builds the historical record that reference class forecasting depends on.
- Estimate against actual shows which categories of work you consistently underestimate.
- Assignable capacity becomes measurable rather than assumed, once meetings and admin are visible as recorded time.
- Effort consumed against scope completed gives the weekly signal that a plan is drifting, before a milestone slips.
See how it works: Monitask workforce analytics.
Sources
- Kahneman, D. and Tversky, A. — original description of the planning fallacy, the tendency to underestimate task completion time even with experience of similar tasks.
- Flyvbjerg, B. — reference class forecasting, the practice of estimating from the distribution of outcomes in comparable past projects rather than from the details of the current one.
- Goldratt, E. — critical chain method, the basis for pooling task-level padding into a single project buffer.
- Working-day and holiday figures for 2026 calculated from the Gregorian calendar and the US Office of Personnel Management federal holiday schedule.
Related reading
- How Many Work Days in a Year?
- How to Write a Work Plan
- Project Milestones in Project Management
- Mastering Scrum Estimation Techniques for Agile Teams
- Budgeting Projects With Remote Employees
- The Importance of Proper Workforce Utilization
FAQ
What are the steps in the project planning process?
Define the outcome, identify stakeholders, set scope, break down the work, estimate effort, sequence dependencies, convert effort into a calendar schedule, identify risks and owners, and agree how progress will be reported.
What is the difference between effort and duration?
Effort is how much work there is, measured in person-days. Duration is how long it takes on a calendar, which depends on capacity, dependencies, weekends and holidays. Thirty working days of effort is 40 to 44 calendar days in 2026 depending on the start month.
How do you calculate project capacity?
Start from headcount, then deduct holidays, leave, meetings and admin. Assignable capacity typically lands between 60% and 75% of gross for knowledge-work teams, and recorded time is the only reliable way to know your own figure.
What is the planning fallacy?
The documented tendency, described by Kahneman and Tversky, to underestimate how long work will take, because people predict from an imagined smooth run rather than from what comparable work actually took.
What is reference class forecasting?
Estimating a project from the actual outcomes of similar past projects rather than from a bottom-up analysis of this one. It generally outperforms bottom-up estimation because it uses results instead of intentions.
Where should buffer go in a project plan?
Pooled into a single project buffer at the end rather than padded into each task. Task-level slack is consumed locally through delayed starts and expanded work, so it protects nothing.
How much buffer should a project have?
Size it against how variable comparable work has been for your team. Without that history, a buffer is a guess, which is one more reason to record time by project.
How do you know a project is slipping before it misses a milestone?
Watch effort consumed against scope completed, and buffer consumed against work completed. Both move weeks before a milestone date does.