
How Many Hours in a Year? Calendar Hours, Work Hours, and Hours Actually Worked

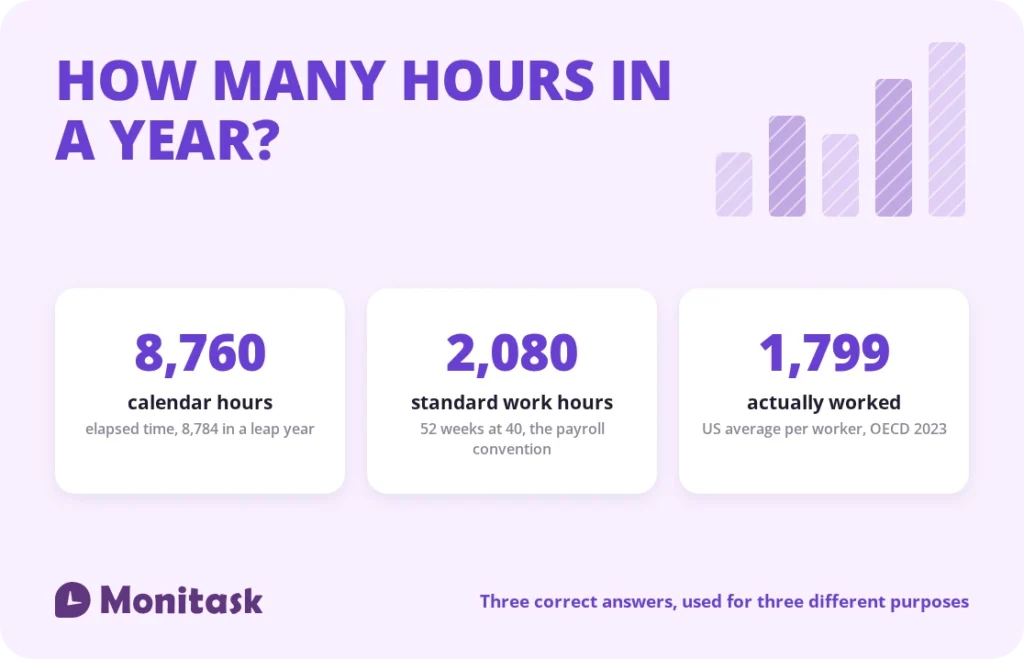
A year contains 8,760 hours, or 8,784 in a leap year. That is the arithmetic answer and it settles the question only if you were asking about elapsed time.
For work, the standard figure is 2,080 hours — 52 weeks at 40 hours. It is the basis for salary-to-hourly conversion, FTE calculations and almost every benchmark you will encounter. It is also an approximation that overstates the hours anyone actually works, because it deducts nothing for holidays or leave.
The realistic figure for a US full-time employee is closer to 1,840 hours once federal holidays and typical leave come out. OECD data puts hours actually worked in the US at 1,799 across all workers.
Which number you need depends entirely on what you are calculating. This guide covers all three and where each belongs.
Quick answer
| Question | Answer |
|---|---|
| Hours in a year | 8,760 (8,784 in a leap year) |
| Hours in a month, on average | 730 |
| Hours in a week | 168 |
| Standard annual work hours | 2,080 |
| Weekday hours in 2026 | 2,088 (261 days × 8) |
| After 11 US federal holidays | 2,000 (250 days × 8) |
| After typical PTO and sick leave | About 1,840 (230 days × 8) |
| Hours actually worked, US average | 1,799 (OECD, 2023, all workers) |
| Hours actually worked, OECD average | 1,683 |
Calendar hours in a year
Straightforward multiplication:
- Common year: 365 × 24 = 8,760 hours
- Leap year: 366 × 24 = 8,784 hours
- Gregorian mean year: 365.2425 × 24 = 8,765.82 hours
The mean year accounts for the fact that 97 of every 400 years are leap years. It matters for infrastructure billing and long-horizon financial modelling, and not at all for payroll.
For reference: a week is 168 hours, a month averages 730, and a quarter runs about 2,190.
The 2,080-hour convention
This is the number that appears in salary calculations, benefits accrual, FTE definitions and benchmark data.
52 weeks × 40 hours = 2,080 hours
Its value is stability. It does not change between years, so a rate calculated on it stays comparable, and everyone using it arrives at the same figure. A $104,000 salary is $50 an hour on this basis, and will be next year too.
It is a convention rather than a measurement, and treating it as a measurement is where errors start.
Why 2,080 is not quite right
Two separate reasons, and they push in opposite directions.
52 weeks is 364 days. A year is 365, so the convention is one day short before anything else is considered. Counting actual weekdays, 2026 contains 261 of them, which is 2,088 hours at eight hours a day. The gap is small but it is the same drift that produces a 27th biweekly payday roughly every eleventh year.
It deducts nothing. No holidays, no leave, no sickness. Nobody works 2,080 hours.
Removing the 11 US federal holidays from 2026 leaves 250 working days, or 2,000 hours. Removing 15 days of PTO and a realistic five sick days leaves 230 days, or 1,840 hours.
So the honest range for a US full-time employee is 1,800 to 1,900 hours against a nominal 2,080. The convention overstates available time by roughly 240 hours a year, which is six working weeks.
Hours actually worked
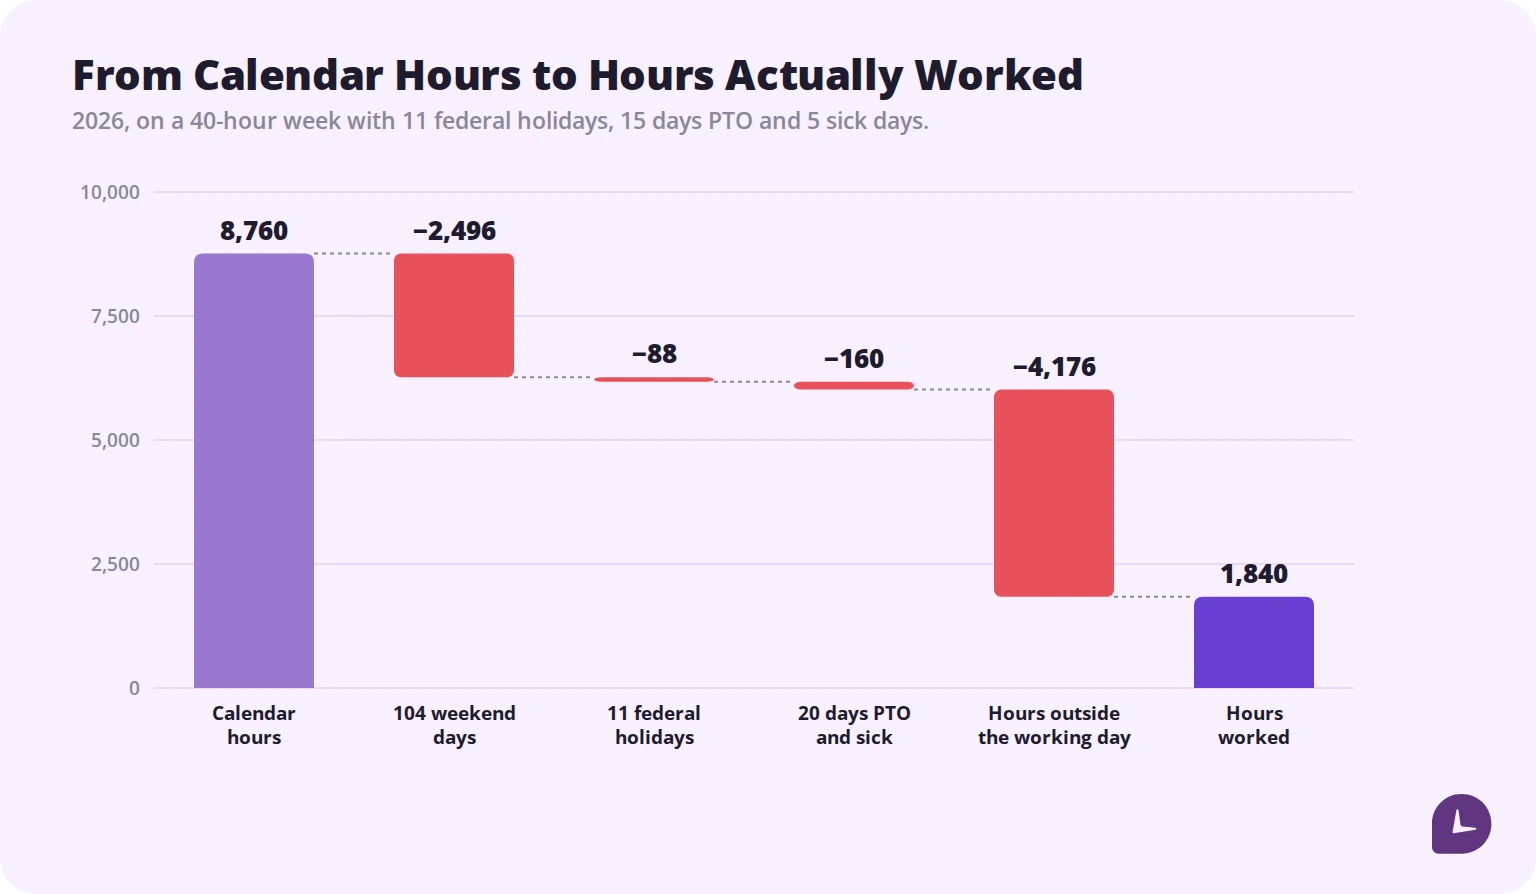
Starting from 8,760 calendar hours in 2026:
| Deduction | Hours |
|---|---|
| Calendar hours | 8,760 |
| 104 weekend days | −2,496 |
| 11 federal holidays | −88 |
| 15 days PTO and 5 sick days | −160 |
| Hours in the day outside working hours | −4,176 |
| Hours worked | 1,840 |
That final figure is 21% of the year. It is worth sitting with when planning anything that assumes a person is available.
And 1,840 is still scheduled hours, not delivered ones. Meetings, admin and context switching consume a substantial share of any working day, which our guide to project planning works through.
Which figure to use when
The most common error in this whole area is using the right number for the wrong job.
| Use | Figure | Why |
|---|---|---|
| Salary-to-hourly conversion | 2,080 | The convention regulators, benchmarks and payroll systems expect |
| FTE calculation | 2,080 | Same reason; see our FTE guide |
| Benefits accrual | 2,080 | Stable year to year |
| Project capacity | Actual working days | 2,080 overstates availability by six weeks |
| Utilisation rate | Actual available hours | A fixed denominator makes the metric wrong most months |
| Labour cost per hour | Actual hours worked | Cost divided by a fictional denominator understates the true rate |
| Benchmarking against other countries | OECD hours worked | The only figure measured the same way across countries |
| Server uptime, infrastructure billing | 8,760 | Elapsed time, not labour |
Pick the figure by the question. Mixing them within a single model is how a quote comes in under cost.
Hours worked by country
| Country | Annual hours worked, 2023 |
|---|---|
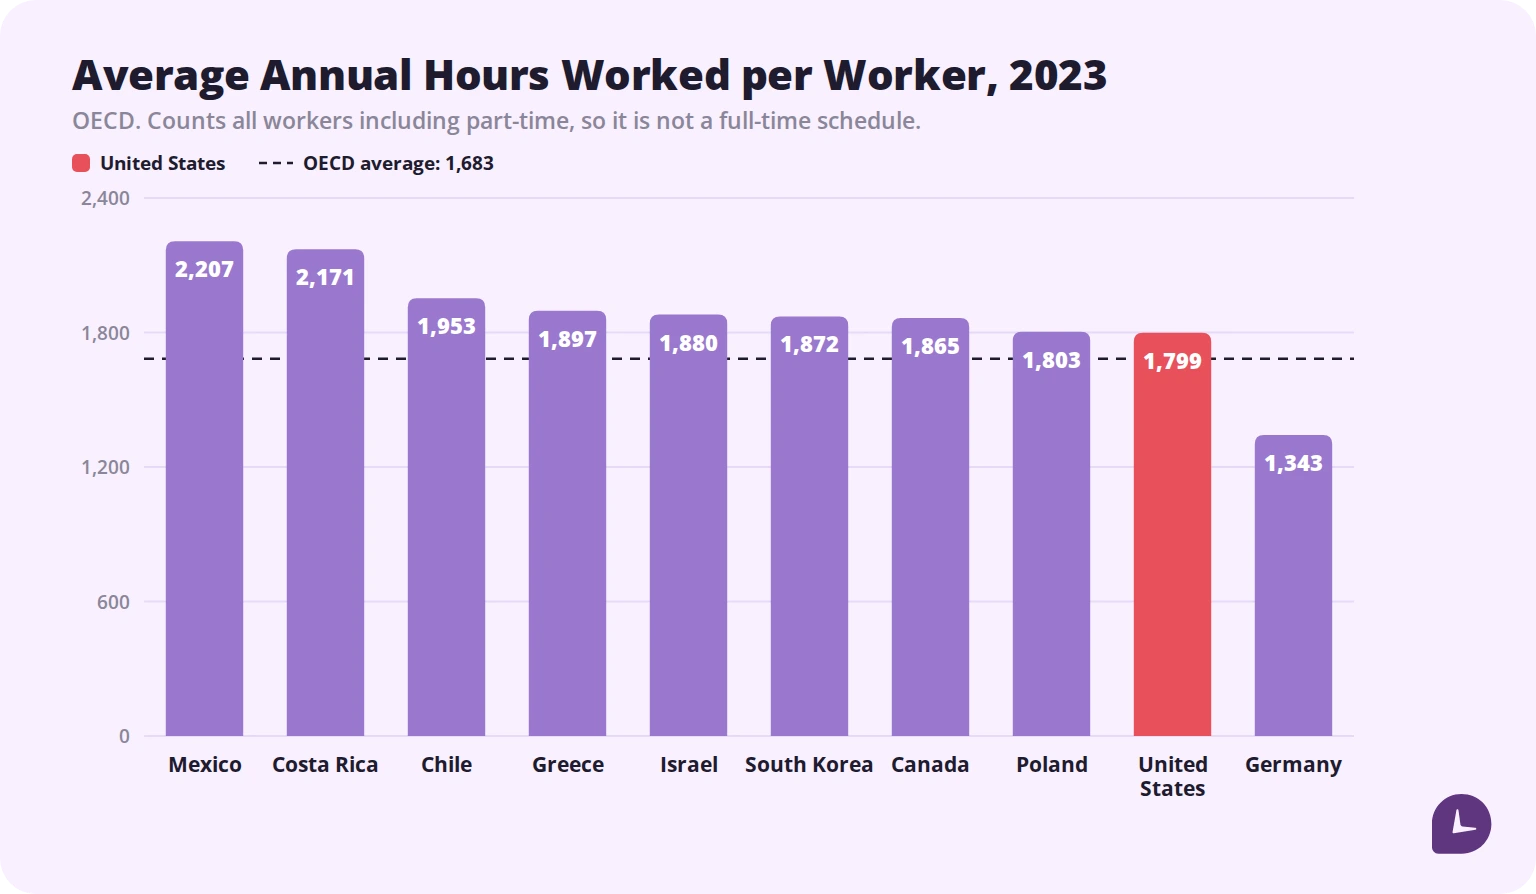
| Mexico | 2,207 |
| Costa Rica | 2,171 |
| Chile | 1,953 |
| Greece | 1,897 |
| Israel | 1,880 |
| South Korea | 1,872 |
| Canada | 1,865 |
| Poland | 1,803 |
| United States | 1,799 |
| OECD average | 1,683 |
| Germany | 1,343 |
Now the part most articles omit. The OECD states plainly that these figures are intended for comparing trends over time and are unsuitable for comparing the level of average annual hours between countries in a given year, because sources and calculation methods differ.
That caveat invalidates the exact use almost every published ranking makes of this data, including the table above if you read it as a league table.
Two specific distortions worth knowing:
Part-time work drags averages down. The figures cover all workers. The Netherlands has an unusually high share of part-time employment, so its average falls without anyone working a shorter full-time week.
The self-employed are included, and they tend to report long hours, which inflates figures in countries with large self-employed or informal sectors.
Use the data for what it is good for: the direction of travel within a country over time. Germany’s figure has fallen steadily; South Korea’s is declining fast from a high base. Those trends are meaningful. A 60-hour gap between two countries in one year is probably measurement.
Part-time and non-standard schedules
| Weekly hours | Annual hours (× 52) | As FTE |
|---|---|---|
| 10 | 520 | 0.25 |
| 20 | 1,040 | 0.50 |
| 25 | 1,300 | 0.63 |
| 30 | 1,560 | 0.75 |
| 35 | 1,820 | 0.88 |
| 37.5 | 1,950 | 0.94 |
| 40 | 2,080 | 1.00 |
| 45 | 2,340 | 1.13 |
| 48 | 2,496 | 1.20 |
Compressed and rotating patterns need their own count. A Pitman schedule on 12-hour shifts comes to 2,190 hours a year, above the standard convention, and generates overtime under standard FLSA rules because the weeks alternate between 36 and 48 hours.
Boost your business productivity
Track performance and streamline teamwork
Converting salary to an hourly rate
Hourly rate = annual salary ÷ 2,080
- $52,000 ÷ 2,080 = $25.00
- $75,000 ÷ 2,080 = $36.06
- $104,000 ÷ 2,080 = $50.00
Use 2,080 for this, not an adjusted figure. It is the convention every comparison assumes, and switching denominators makes your rate incomparable to everyone else’s.
The reverse is also worth having: annual salary ≈ hourly rate × 2,080. A $30 hourly rate is roughly $62,400 a year at full-time hours before overtime.
For the true cost of an hour, though, divide total employment cost by hours actually worked rather than by 2,080. A $75,000 salary with a 25% burden is $93,750, and against 1,840 real hours that is $50.95 per hour, not the $36.06 the salary conversion suggests. Underpricing that gap is one of the more common ways professional services firms lose margin. Our guide to labour costs goes further.
Common mistakes
Using 8,760 for anything to do with labour. It is elapsed time.
Planning capacity against 2,080. It overstates availability by around six weeks.
Using an adjusted figure for salary conversion. 2,080 is the convention; deviating from it breaks comparability.
Ranking countries on OECD annual hours. The OECD says the data is not built for that.
Ignoring part-time composition in national averages. A low average can mean many part-timers rather than short full-time weeks.
Costing an hour at the salary rate. Total cost divided by actual hours is a much larger number.
Assuming 2,080 and 2,088 are interchangeable. They differ by a day, which is the same drift behind the 27th payday.
How Monitask helps
Every figure above except the last one is calculated. Hours actually worked is the only one that has to be measured, and it is the one that decides whether a rate, a quote or a capacity plan was right.
Monitask records hours as they happen. Employees clock in when they start and clock out when they stop, so nothing runs in the background without their knowledge.

- Annual and monthly totals based on recorded time, so capacity models start from evidence rather than 2,080.
- Billable against non-billable hours, which is what turns an hourly rate into a real cost per delivered hour.
- Project time histories that make the next estimate better than the last.
- Hours by workweek aligned with the period the FLSA uses for overtime.
See how it works: Monitask online timesheets.
Sources
- OECD, Hours worked — average annual hours actually worked per worker, with the OECD’s own statement that the data suits trend comparison over time and is unsuitable for comparing levels between countries in a given year.
- OECD 2023 country figures for average annual hours worked per worker.
- US Department of Labor, Fact Sheet #23: Overtime Pay Requirements of the FLSA — the fixed workweek used for overtime.
- US Office of Personnel Management, Federal Holidays — the 11 federal holidays deducted above.
- Weekday and working-day counts for 2026 calculated from the Gregorian calendar.
Related reading
- How Many Work Days in a Year?
- How Many Work Weeks in a Year?
- How Many Hours in a Month?
- How Many Pay Periods in a Year?
- FTE Meaning
- Understanding and Calculating Your Labor Costs
FAQ
How many hours are worked in a year?
2,080 by the standard convention of 52 weeks at 40 hours. After US federal holidays it is 2,000, and after typical leave around 1,840. OECD data puts hours actually worked in the US at 1,799 across all workers.
Why is 2,080 the standard?
Because 52 Г— 40 = 2,080 and the figure does not change between years, which makes salary conversions and benchmarks comparable. It is a convention rather than a measurement of anyone’s actual hours.
How many work hours are in a year after holidays?
2,000 in 2026, from 250 working days at eight hours, once the 11 federal holidays are removed from 261 weekdays.
How do I convert my salary to an hourly rate?
Divide the annual salary by 2,080. A $52,000 salary is $25 an hour. Use 2,080 rather than an adjusted figure, because that is the basis every comparison assumes.
Which country works the most hours?
In OECD 2023 data, Mexico at 2,207 hours, followed by Costa Rica at 2,171. Germany is lowest at 1,343. The OECD cautions that these figures are meant for tracking trends over time rather than ranking countries in a single year.
How many hours does the average American work per year?
1,799 according to OECD 2023 data, which covers full-time, part-time and self-employed workers. A full-time employee schedules closer to 2,000 before leave.
How many hours is part-time per year?
1,040 hours at 20 hours a week, or 1,560 at 30 hours. Divide by 2,080 for the FTE equivalent.
How many hours in a month?
730 on average, ranging from 672 in February to 744 in a 31-day month.
What is the real cost of an hour of work?
Total employment cost divided by hours actually worked. A $75,000 salary with a 25% burden against 1,840 real hours is about $50.95 an hour, not the $36.06 the salary conversion gives.